
- Title
-
MMP-2/9 inhibition modulates sharp wave abundance, inhibitory proteoglycan sulfation, and fear memory in juvenile zebrafish: relevance to affective disorders
- Authors
- Blanco, I., Deasy, S., Amontree, M., Gabriel, M., Caccavano, A., Vicini, S., Glasgow, E., Conant, K.
- Source
- Full text @ Mol. Psychiatry
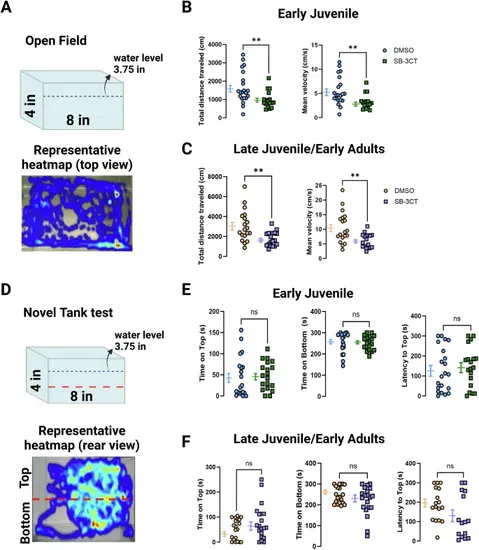
MMP-2/9 inhibition decreases locomotion independently from anxiety/stress in zebrafish.A Top panel: representative cartoon of the Open field tank with dimensions and water level. Bottom panel: representative heatmap of the explorative trajectory of a juvenile DMSO-treated zebrafish. B Quantification of total distance traveled and mean velocity for early juvenile zebrafish. C Quantification of total distance traveled and mean velocity for late juvenile/early adult zebrafish. D Top panel: representative cartoon of the Novel Tank with dimensions, water level, and division of top versus bottom compartments (red dashed line). Note that the same setup was used to measure both behaviors. Bottom panel: representative heatmap of the trajectory of a juvenile non-treated zebrafish showing their time in each compartment. E Quantification of the time spent on either top or bottom compartment in the Novel Tank test as well as latency to reach the top of the tank for early juvenile zebrafish. F Quantification of the same parameters for late juvenile/early adult zebrafish. Unpaired Student’s t and Mann-Whitney tests. Graphs are expressed as mean ± S.E.M. Data were acquired with EthoVision XT16 software. **p < 0.01. Created in BioRender. https://BioRender.com/bvwowsr. |
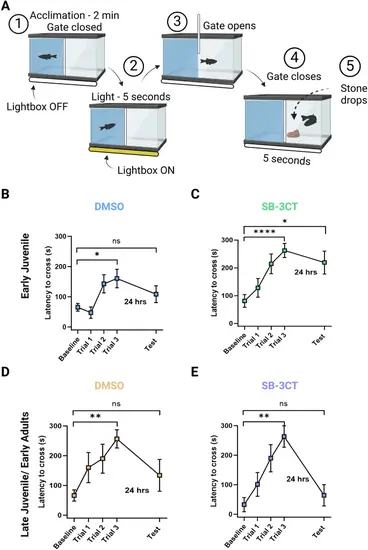
MMP-2/9 inhibition enhances fear memory retention in early juvenile zebrafish. A Representative cartoon of the Passive avoidance behavior setup. Numbers correspond to: (1) acclimation, (2) lightbox ON, (3) gate opens, (4) gate closes, (5) stone drops. B–E Graphs represent the latency to cross from the blue compartment to the transparent compartment at baseline and three consecutive trials on Day 1, and 24 h later (Day 2) for B–C DSMO- and SB-3CT-treated early juvenile zebrafish and D–E DSMO- and SB-3CT-treated late juvenile/early adult zebrafish. Data is represented as mean ± S.E.M. Independent Paired Student’s t tests were performed between baseline and trials on Day 1 and Mann-Whitney tests were performed between baseline and testing day. *p < 0.05, **p < 0.01, ****p < 0.0001. Created in BioRender. https://BioRender.com/wpn40zv. |
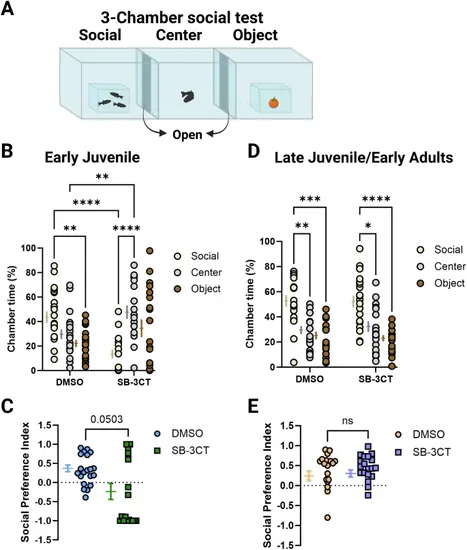
MMP-2/9 inhibition decreases sociability in early juvenile zebrafish. A Representative cartoon of the 3-Chamber social test. B Shows the percentage of time spent in either chamber for early juvenile zebrafish treated with either DMSO (left) or SB-3CT (right). 2Way ANOVA with Tukey’s multiple comparisons. C Shows the social preference index for DMSO- and SB-3CT-treated early juvenile zebrafish. Mann-Whitney test. D and E are representations of the same measurements but for late juvenile/early adult zebrafish. Graphs are represented as mean ± S.E.M. *p < 0.05, **p < 0.01, ***p < 0.001, ****p < 0.0001. Created in BioRender. https://BioRender.com/5piw3cr. |
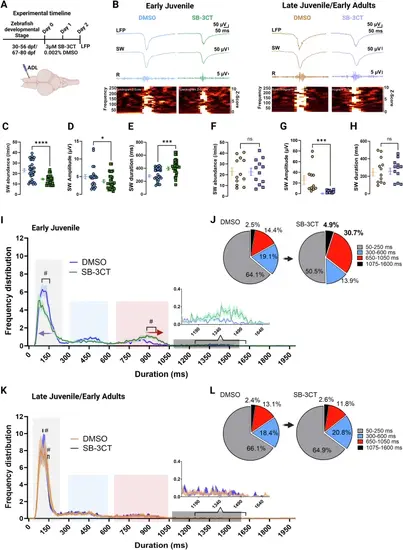
MMP-2/9 inhibition decreases the abundance and amplitude of SWs while enriching the percentage of longer duration SW events in early juvenile zebrafish. A Top: Experimental timeline for SB-3CT drug exposure and LFP recordings. Bottom: representative cartoon image of electrode placement in the ADL of ex vivo whole brain preparations. B Representative traces of SWR events from early juvenile zebrafish treated and not treated with SB-3CT (left) and late juvenile/early adults (right). LFP recordings (1–1000 Hz), filtered SW events (1–30 Hz), filtered ripple events (120–220 Hz), and frequency spectrogram. C–E Quantification of SW abundance, amplitude, and duration between DMSO- and SB-3CT-treated early juvenile zebrafish. F–H Quantification of SW abundance, amplitude, and duration between DMSO- and SB-3CT-treated late juvenile/early adult zebrafish. Mann-Whitney and Unpaired t tests. I Frequency distribution of SW duration for early juvenile zebrafish and K for late juvenile/early adult zebrafish between groups. Duration clusters are color-coded for identification: light gray represents cluster 1 (50–250 ms), light blue represents cluster 2 (300–600 ms), light red represents cluster 3 (650–1050 ms), and dark gray represents cluster 4 (1075–1600 ms). Solid lines correspond to the mean and the shaded area shows the S.E.M. The purple arrow shows a shift to the left in the frequency distribution of SW events from treated zebrafish whereas the red arrow shows a shift to the right. 2way ANOVA with Šídák’s multiple comparisons test (# represents significance). J, L Quantification of the percentage of SW events within a specified cluster and their change after MMP-2/9 inhibition. Graphs are expressed as mean ± S.E.M. *p < 0.05, ***p < 0.001, ****p < 0.0001. Created in BioRender. https://BioRender.com/y371lgm. |
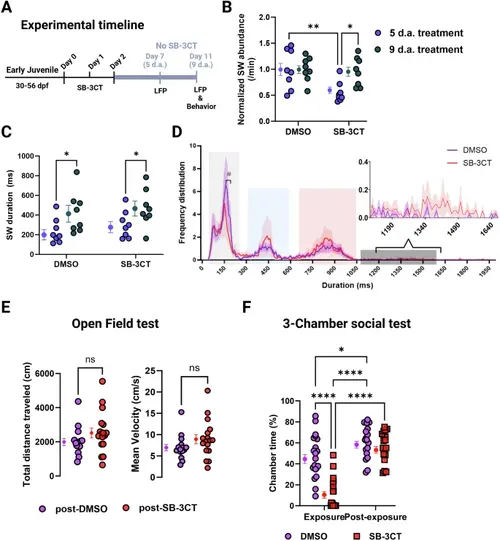
MMP-2/9 ‘dis-inhibition’ reverses changes in SW events and behavior in early juvenile zebrafish. A Time line of experiments. B Normalized quantification of SW abundance 5 and 9 d.a. DMSO or SB-3CT treatment. 2way ANOVA with Uncorrected Fisher’s LSD. C Quantification of the average duration of SW events between groups at 5 and 9 d.a. 2way ANOVA with Uncorrected Fisher’s LSD. D Frequency distribution of SW duration for early juvenile zebrafish 9 d.a. treatment with either DMSO or SB-3CT. Duration clusters are color-coded for identification: light gray represents cluster 1 (50–250 ms), light blue represents cluster 2 (300–600 ms), light red represents cluster 3 (650–1050 ms), and dark gray represents cluster 4 (1075–1600 ms). Solid lines correspond to the mean and the shaded area shows the S.E.M. 2way ANOVA with Šídák’s multiple comparisons test (# represents significance). E Quantification of total distance traveled and mean velocity. Data were acquired with EthoVision XT16 software. Mann-Whitney test. F Quantification of sociability during exposure (from Fig. 4B) and post-exposure. 2way ANOVA with Tukey’s multiple comparison’s test. Graphs are expressed as mean ± S.E.M. *p < 0.05, **p < 0.01, ****p < 0.0001. Created in BioRender. https://BioRender.com/ti6pu7f. |
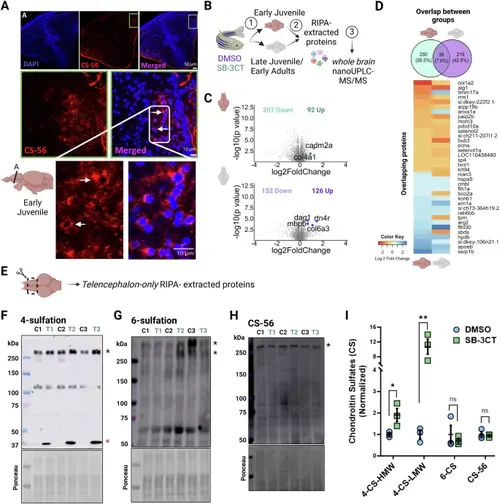
MMP-2/9 inhibition increases plasticity restricting 4-O-sulfated CSPGs with no difference in plasticity permissive 6-O-sulfated CSPGs. A Representative image of chondroitin sulfate (CS)-rich PNNs surrounding the cell body of cells (white arrows) within the telencephalon of early juvenile zebrafish. B Representative workflow of the proteomics assay using whole brain lysates. C Volcano plots showing downregulated and upregulated proteins after MMP-2/9 inhibition with identified known MMP-9 substrates in both groups. D Shows the percentage of overlapping and non-overlapping proteins between groups. E Representative cartoon image of a zebrafish brain showing the part of the brain (telencephalon-only) used for Western blot analyses. F–H Representative pooled telencephalon-only Western blots for 4-O-sulfation, 6-O-sulfation, and CS-56, respectively. An average of 10–15 zebrafish telencephalon-only were pooled per group (n = 3). For 4- and 6-O-sulfation, samples were first digested with ChABC. I Quantification of Western blots. Quantified bands are highlighted using asterisks. Specifically, for 4-O-sulfation high molecular weight (HMW) band is denoted by the black asterisk while the low molecular weight (LMW) band is denoted by the red asterisk. For 6-O-sulfation quantification, both HMW bands were averaged for quantification. Graphs are expressed as mean ± S.E.M. Unpaired t-test. *p < 0.05, **p < 0.01. Created in BioRender. https://BioRender.com/3xjj2ln. |