
|
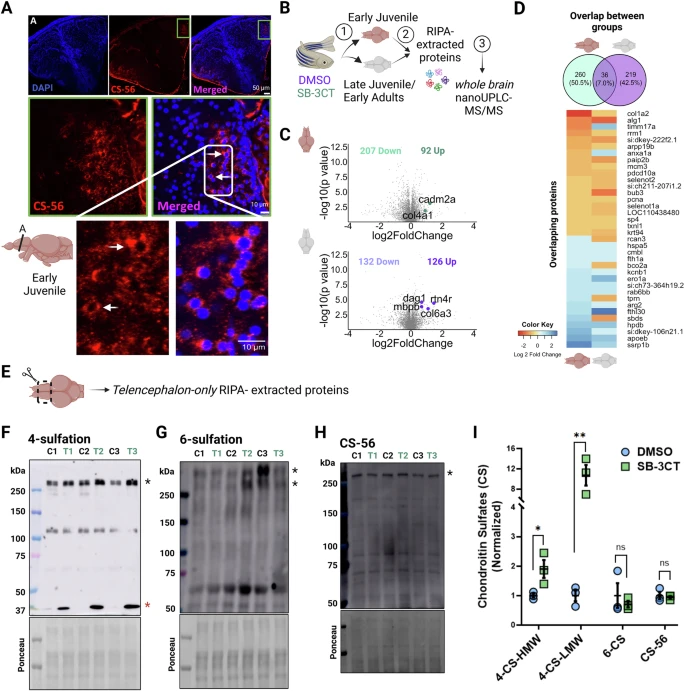
Fig. 6 MMP-2/9 inhibition increases plasticity restricting 4-O-sulfated CSPGs with no difference in plasticity permissive 6-O-sulfated CSPGs. A Representative image of chondroitin sulfate (CS)-rich PNNs surrounding the cell body of cells (white arrows) within the telencephalon of early juvenile zebrafish. B Representative workflow of the proteomics assay using whole brain lysates. C Volcano plots showing downregulated and upregulated proteins after MMP-2/9 inhibition with identified known MMP-9 substrates in both groups. D Shows the percentage of overlapping and non-overlapping proteins between groups. E Representative cartoon image of a zebrafish brain showing the part of the brain (telencephalon-only) used for Western blot analyses. F–H Representative pooled telencephalon-only Western blots for 4-O-sulfation, 6-O-sulfation, and CS-56, respectively. An average of 10–15 zebrafish telencephalon-only were pooled per group (n = 3). For 4- and 6-O-sulfation, samples were first digested with ChABC. I Quantification of Western blots. Quantified bands are highlighted using asterisks. Specifically, for 4-O-sulfation high molecular weight (HMW) band is denoted by the black asterisk while the low molecular weight (LMW) band is denoted by the red asterisk. For 6-O-sulfation quantification, both HMW bands were averaged for quantification. Graphs are expressed as mean ± S.E.M. Unpaired t-test. *p < 0.05, **p < 0.01. Created in BioRender. https://BioRender.com/3xjj2ln.