
|
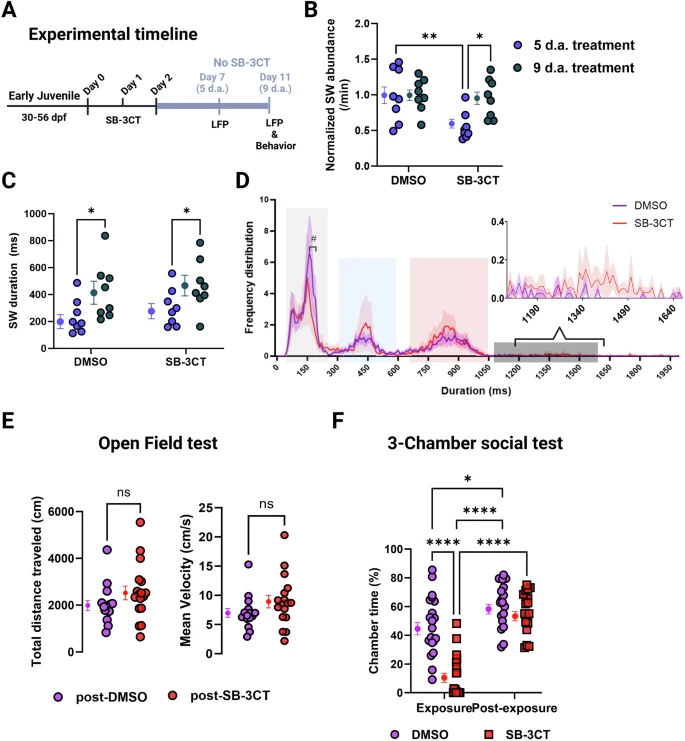
Fig. 5 MMP-2/9 ‘dis-inhibition’ reverses changes in SW events and behavior in early juvenile zebrafish. A Time line of experiments. B Normalized quantification of SW abundance 5 and 9 d.a. DMSO or SB-3CT treatment. 2way ANOVA with Uncorrected Fisher’s LSD. C Quantification of the average duration of SW events between groups at 5 and 9 d.a. 2way ANOVA with Uncorrected Fisher’s LSD. D Frequency distribution of SW duration for early juvenile zebrafish 9 d.a. treatment with either DMSO or SB-3CT. Duration clusters are color-coded for identification: light gray represents cluster 1 (50–250 ms), light blue represents cluster 2 (300–600 ms), light red represents cluster 3 (650–1050 ms), and dark gray represents cluster 4 (1075–1600 ms). Solid lines correspond to the mean and the shaded area shows the S.E.M. 2way ANOVA with Šídák’s multiple comparisons test (# represents significance). E Quantification of total distance traveled and mean velocity. Data were acquired with EthoVision XT16 software. Mann-Whitney test. F Quantification of sociability during exposure (from Fig. 4B) and post-exposure. 2way ANOVA with Tukey’s multiple comparison’s test. Graphs are expressed as mean ± S.E.M. *p < 0.05, **p < 0.01, ****p < 0.0001. Created in BioRender. https://BioRender.com/ti6pu7f.