- Title
-
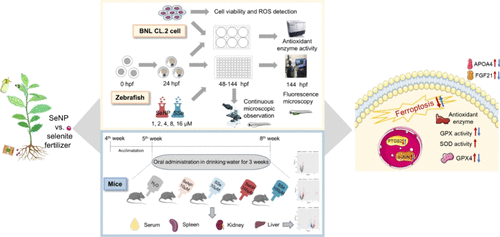
Selenium Nanoparticles vs Selenite Fertilizers: Implications for Toxicological Profiles, Antioxidant Defense, and Ferroptosis Pathways
- Authors
- Fang, Q., Liu, Z., Wang, K.
- Source
- Full text @ J. Agric. Food Chem.
|
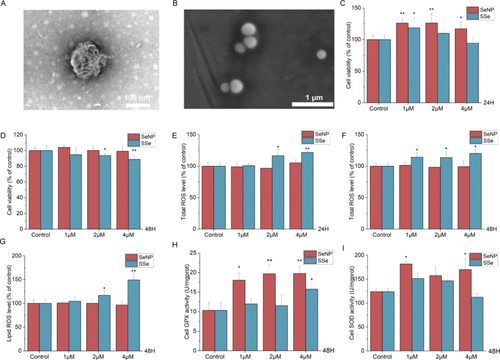
Influence of SeNP and SSe on cytotoxicity of BNL CL.2 cells. (A) TEM image of SeNP. Scale bar: 100 nm. (B) SEM image of SeNP. Scale bar: 1 μm. (C, D) Cell viability after 24 or 48 h treatment. (E, F) Total ROS level after 24 or 48 h treatment. (G) Lipid ROS level after 48 h treatment. (H) Cell GPX activity after 48 h treatment. (I) Cell SOD activity after 48 h treatment. * p < 0.05 vs Control, ** p < 0.01 vs Control. |
|
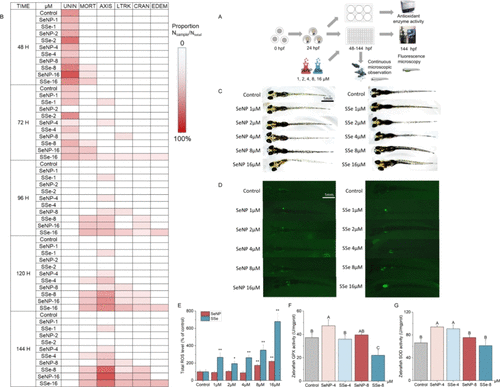
Influence and potential toxicity of different concentration of SeNP and SSe on zebrafish. (A) Embryo toxicity assay schematic diagram. (B) Morphologic change of zebrafish during the expose of SeNP and SSe from 48 hpf to 144 hpf. The color scale represented the ratio of the number of occurrences to the total. UNIN: unincubated; MORT: mortality; AXIS: deformation of axis; LTRK: deformation of lower trunk; CRAN: deformation of eye/snout/jaw; EDEM: heart or yolk sac malformation and edema. (C) Images of 144 hpf larvae. Scale bar: 1 mm. (D) Images of 144 hpf larvae loaded with DCFH-DA probe, the fluorescence represented ROS level. Scale bar: 1 mm. (E) Quantitative analysis of fluorescence in (D). (F) Zebrafish GPX activity at 144 hpf. (G) Zebrafish SOD activity at 144 hpf. The data represent the mean value ± SD. Different capital letters indicate significant differences among groups (p < 0.05). * p < 0.05 vs Control, ** p < 0.01 vs Control. |
|
Growth, splenic, and renal conditions of mice were altered by different Se-chemicals treatment. (A) Murine assay schematic diagram. (B) Body weight. (C) Liquid intake and Se intake for one mouse. L: low-Se group received drinking water containing 10 μM Se; H: high-Se group received drinking water containing 100 μM Se. (D) Splenic Se distribution. (E) Images of spleen (scale bar: 1 cm), HE staining (scale bar: 500 μm for 40×, 100 μm for 200×), and IHC of F4/80 (scale bar: 500 μm). (F) Spleen index. (G) Quantitative analysis of F4/80 expression in (E). (H) Images of renal HE staining. The rectangular box indicating denatured and shrunken glomeruli. The arrows pointing to deformed renal tubular epithelial cells. Scale bar: 500 μm for 40×, 50 μm for 400×. (I) Renal Se distribution. (J) Serum creatinine (CREA). The data represent the mean value ± SD. Different capital letters indicate significant differences among groups (p < 0.05). |
|
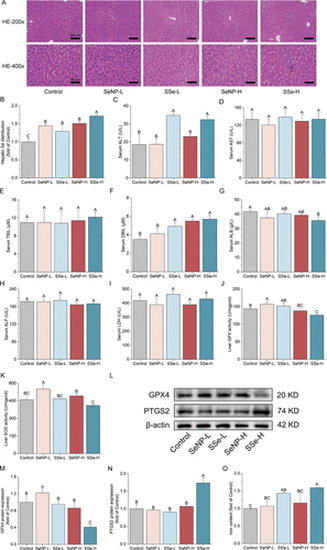
Liver functions were altered by different Se-chemicals treatment. (A) Images of hepatic HE staining. The arrow pointing to inflammatory cell infiltration. Scale bar: 100 μm for 200×, 50 μm for 400×. (B) Hepatic Se distribution. (C) Serum alanine aminotransferase (ALT). (D) Serum aspartate aminotransferase (AST). (E) Serum total bilirubin (TBIL). (F) Serum direct bilirubin (DBIL). (G) Serum albumin (ALB). (H) Serum alkaline phosphatase (ALP). (I) Serum lactate dehydrogenase (LDH). (J) Liver GPX activity. (K) Liver SOD activity. (L) GPX4 and PTGS2 protein expression by Western blot. (M, N) Quantitative analysis of protein expression in (L). (O) Iron content of liver. The data represent the mean value ± SD. Different capital letters indicate significant differences among groups (p < 0.05). |
|
SeNP increased FGF21 and SSe decreased c-JUN expression analyzed by murine liver transcriptional profile. (A) Venn diagram showing the number of shared and different gene in compared groups. (B) Volcano plot visualizing the fold change of DEGs in SeNP vs SSe. (C) mRNA expression of FGF21. (D) IHC image for FGF21 protein. Scale bar: 100 μm for 200×, 50 μm for 400×. (E) Quantitative analysis of FGF21 expression in (D). (F, G) GO enrichment analysis of SeNP vs SSe with upregulated and downregulated DEGs. (H) mRNA expression of c-JUN. (I) c-JUN protein expression by Western blot. (J) Quantitative analysis of c-JUN protein expression in (I). The data represent the mean value ± SD. Different capital letters indicate significant differences among groups (p < 0.05). |
|
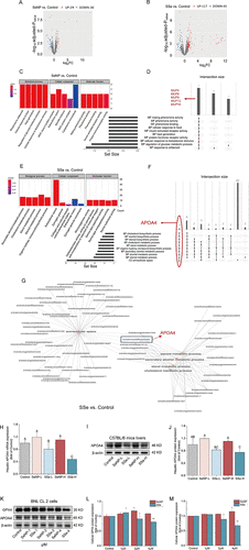
APOA4 downregulation caused the potent toxicity of SSe compared to SeNP. (A, B) Volcano plot visualizing the fold change of DEGs in SeNP vs Control and SSe vs Control of murine livers. (C, E) GO enrichment analysis of SeNP vs Control and SSe vs Control of murine livers. (D, F) Upset plot showing the shared DEGs in GO enrichment pathways of SeNP vs Control and SSe vs Control of murine livers. (G) GO enrichment network plot of DEGs of SSe vs Control of murine livers. (H) APOA4 mRNA expression of murine livers. (I) APOA4 protein expression of murine livers by Western blot. (J) Quantitative analysis of APOA4 protein expression of murine livers in (I). (K) GPX4 and APOA4 protein expression of BNL CL.2 cell by Western blot. (L, M) Quantitative analysis of protein expression in (K). The data represent the mean value ± SD. Different capital letters indicate significant differences among groups (p < 0.05). * p < 0.05 vs Control, ** p < 0.01 vs Control. |
|
|

