
FIGURE
Fig. 1
- ID
- ZDB-FIG-250611-60
- Publication
- Fang et al., 2025 - Selenium Nanoparticles vs Selenite Fertilizers: Implications for Toxicological Profiles, Antioxidant Defense, and Ferroptosis Pathways
- Other Figures
- All Figure Page
- Back to All Figure Page
Fig. 1
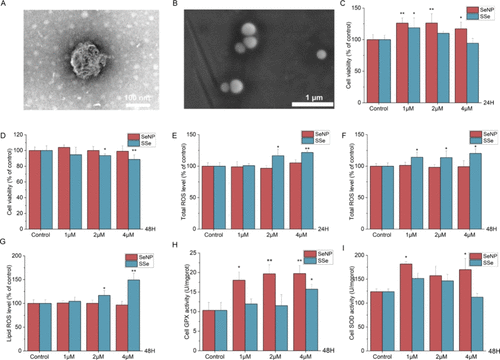
Influence of SeNP and SSe on cytotoxicity of BNL CL.2 cells. (A) TEM image of SeNP. Scale bar: 100 nm. (B) SEM image of SeNP. Scale bar: 1 μm. (C, D) Cell viability after 24 or 48 h treatment. (E, F) Total ROS level after 24 or 48 h treatment. (G) Lipid ROS level after 48 h treatment. (H) Cell GPX activity after 48 h treatment. (I) Cell SOD activity after 48 h treatment. * p < 0.05 vs Control, ** p < 0.01 vs Control. |
Expression Data
Expression Detail
Antibody Labeling
Phenotype Data
Phenotype Detail
Acknowledgments
This image is the copyrighted work of the attributed author or publisher, and
ZFIN has permission only to display this image to its users.
Additional permissions should be obtained from the applicable author or publisher of the image.
Full text @ J. Agric. Food Chem.