Fig. 4
- ID
- ZDB-FIG-250611-63
- Publication
- Fang et al., 2025 - Selenium Nanoparticles vs Selenite Fertilizers: Implications for Toxicological Profiles, Antioxidant Defense, and Ferroptosis Pathways
- Other Figures
- All Figure Page
- Back to All Figure Page
|
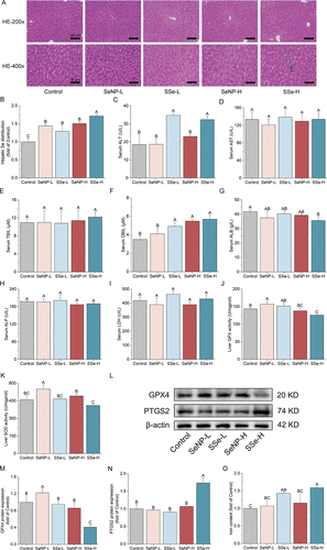
Liver functions were altered by different Se-chemicals treatment. (A) Images of hepatic HE staining. The arrow pointing to inflammatory cell infiltration. Scale bar: 100 μm for 200×, 50 μm for 400×. (B) Hepatic Se distribution. (C) Serum alanine aminotransferase (ALT). (D) Serum aspartate aminotransferase (AST). (E) Serum total bilirubin (TBIL). (F) Serum direct bilirubin (DBIL). (G) Serum albumin (ALB). (H) Serum alkaline phosphatase (ALP). (I) Serum lactate dehydrogenase (LDH). (J) Liver GPX activity. (K) Liver SOD activity. (L) GPX4 and PTGS2 protein expression by Western blot. (M, N) Quantitative analysis of protein expression in (L). (O) Iron content of liver. The data represent the mean value ± SD. Different capital letters indicate significant differences among groups (p < 0.05). |

