
Fig. 2
- ID
- ZDB-FIG-250611-61
- Publication
- Fang et al., 2025 - Selenium Nanoparticles vs Selenite Fertilizers: Implications for Toxicological Profiles, Antioxidant Defense, and Ferroptosis Pathways
- Other Figures
- All Figure Page
- Back to All Figure Page
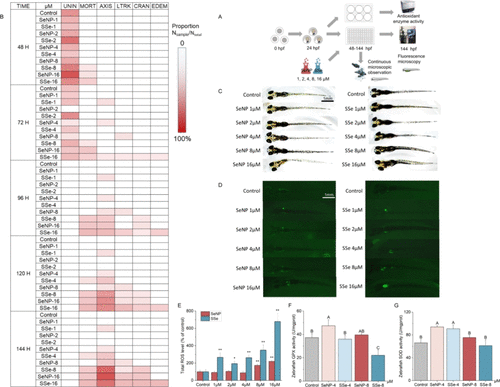
Influence and potential toxicity of different concentration of SeNP and SSe on zebrafish. (A) Embryo toxicity assay schematic diagram. (B) Morphologic change of zebrafish during the expose of SeNP and SSe from 48 hpf to 144 hpf. The color scale represented the ratio of the number of occurrences to the total. UNIN: unincubated; MORT: mortality; AXIS: deformation of axis; LTRK: deformation of lower trunk; CRAN: deformation of eye/snout/jaw; EDEM: heart or yolk sac malformation and edema. (C) Images of 144 hpf larvae. Scale bar: 1 mm. (D) Images of 144 hpf larvae loaded with DCFH-DA probe, the fluorescence represented ROS level. Scale bar: 1 mm. (E) Quantitative analysis of fluorescence in (D). (F) Zebrafish GPX activity at 144 hpf. (G) Zebrafish SOD activity at 144 hpf. The data represent the mean value ± SD. Different capital letters indicate significant differences among groups (p < 0.05). * p < 0.05 vs Control, ** p < 0.01 vs Control. |