FIGURE SUMMARY
Title

A sensitive soma-localized red fluorescent calcium indicator for in vivo imaging of neuronal populations at single-cell resolution

Authors
Zhou, S., Zhu, Q., Eom, M., Fang, S., Subach, O.M., Ran, C., Alvarado, J.S., Sunkavalli, P.S., Dong, Y., Wang, Y., Hu, J., Zhang, H., Wang, Z., Sun, X., Yang, T., Mu, Y., Yoon, Y.G., Guo, Z.V., Subach, F.V., Piatkevich, K.D.
Source
Full text @ PLoS Biol.

Design of FRCaMPi and characterization in HeLa cells.

(A) FRCaMPi sensor is created by topological inversion of FRCaMP. Upper panel, a diagram showing the design of FRCaMP and FRCaMPi; the lower panel predicted 3D protein structures of indicators75 and a table of amino acid sequences of the linkers. (B) Basal brightness and photobleaching curves of red GECIs characterized in transfect HeLa cells by side-by-side comparison. For the plasmids used to transfect HeLa cells, a nuclear exclusion sequence (NES) was added to each red GECI and mGreenLantern reference was attached via a P2A peptide to express red and green FP in near equimolar ratio. *NES was not added to XCaMP-R due to the presence of F2A sequence C-terminal reported to have nuclear exclusion. The basal fluorescence of red GECIs (Fred) was normalized against the fluorescence of mGreenLantern (Fgreen). Fluorescence trace of FRCaMPi, jRGECO1a, XCaMP-R, and K-GECO1 over 10-min photobleaching, normalized to the mean brightness of jRGECO1a in the first frame. (C) Representative images showing the expression of mGreenLantern and FRCaMPi in HeLa cells. (D) Representative fluorescence trace induced by histamine (50 μM) and ionomycin (5 μM) in HeLa cells expressing K-GECO1, XCaMP-R, jRGECO1a, and FRCaMPi. (E) ΔFmax/Fmin of FRCaMPi compared to other red GECIs during the period of pharmaceutically induced Ca2+ response (K-GECO1: n = 53 cells from 4 wells; XCaMP-R: n = 71 cells from 5 wells; jRGECO1a: n = 50 cells from 4 wells; FRCaMPi: n = 50 cells from 4 wells, two independent cultures). Kruskal–Wallis multiple-comparison test: p < 1 × 10–15. Pairwise Dunn’s comparison test with FRCaMPi: p = 5.92e–5 (jRGECO1a), p = 9.73e–7 (XCaMP-R) and p < 1e–15 (K-GECO1). (F) Scatter plot of ΔFmax/Fmin against basal brightness of individual cells. Statistics were the same as (E). The quantitative data presented in this figure can be found in S1 Data.

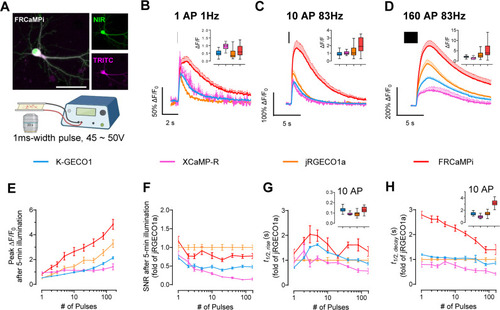
Characterization of FRCaMPi in primary mouse hippocampal neurons.

(A) FRCaMPi sensor is created by topological inversion of FRCaMP. Upper panel, a diagram showing the design of FRCaMP and FRCaMPi; the lower panel predicted 3D protein structures of indicators 75 and a table of amino acid sequences of the linkers. Representative images of a neuron co-expressing FRCaMPi (TRITC) and emiRFP670 (NIR) (top) and schematics of field stimulation protocol (n = 5 neurons from two independent cultures). Scale bar, 50 µm. (B–D) Averaged fluorescence traces generated in response to (B) one pulse, (C) 10 pulses, and (D) 160 pulses for tested GECIs. Traces are shown as mean ± s.e.m, indicated by solid lines and shaded area, respectively (K-GECO1, n = 54 cells from 3 coverslips, 2 independent cultures; XCaMP-R, n = 24 cells from 2 coverslips, 2 independent cultures; jRGECO1a, n = 65 cells from 4 coverslips, 3 independent cultures; FRCaMPi, n = 56 cells from 6 coverslips, 3 independent cultures). Graph inset displays boxplot of peak ΔF/F0 of each GECI to applied action potentials. (E) Peak ΔF/F0 of FRCaMPi compared to other red GECIs as a function of pulses. Descriptive statistics here and for panels g,h,i same as in C–E. (F) Normalized SNR of FRCaMPi compared to other red GECIs as a function of pulses. Normalized to the mean value of jRGECO1a at each used pulse number. (G) The half the rise time of red GECIs as a function of pulses. (I) Half decay time of red GECIs as a function of pulses. Graph inset displays boxplot of half rise/decay time of each GECI after 10 action potentials. Box plots are used here (insets in panels C, D, E, H, I). Box indicates the median and 25–75th percentile range, and the whiskers represent 1.5 times the interquartile range. Line plots are used here (E–H) and throughout the paper (dot, mean; error bars, s.e.m.) See S4 Table for detailed statistics and exact p values. The quantitative data presented in this figure can be found in S1 Data. Created in BioRender, https://BioRender.com/e01g235.

SomaFRCaMPi engineering and characterization via electric field stimulation in primary mouse hippocampal neurons.

(A, B) Schematics of expression cassette and neurons showing the engineering of soma-localized red GECIs by tethering red GECI to ribosome via rpl10a peptide. (C) Representative images of a neuron co-expressing SomaFRCaMPi (TRITC) and emiRFP670 (NIR) (n = 5 from two independent neuronal cultures). Scale bar, 50 µm. (D–G) Plot of fluorescence intensity along neurites, normalized to the intensity at the soma, from neurons expressing either (D) K-GECO1 or SomaK-GECO1, (E) XCaMP-R or SomaXCaMP-R, (F) jRGECO1a or SomajRGECO1a, (G) FRCaMPi or SomaFRCaMPi (K-GECO1: n = 6 neurites from 5 cells; SomaK-GECO1: n = 7 neurites from 5 cells; XCaMP-R: n = 6 neurites from 5 cells; SomaXCaMP-R: n = 6 neurites from 4 cells; jRGECO1a: n = 6 neurites from 5 cells; SomajRGECO1a: n = 6 neurites from 5 cells; FRCaMPi: n = 7 neurites from 6 cells; SomaFRCaMPi: n = 6 neurites from 6 cells). An unpaired student t-test was used. Dots, individual neurites; solid line, exponential fitting curve. The data of the non-targeted indicator was colored in gray to aid visualization. (H) Baseline brightness of soma-localized red GECIs characterized in primary hippocampal neurons by side-by-side comparison (SomaK-GECO1: n = 90 cells from 5 wells; SomaXCaMP-R: n = 84 cells from 4 wells; SomajRGECO1a: n = 85 cells from 5 wells; SomaFRCaMPi: n = 101 cells from 5 wells, two independent cultures). Kruskal–Wallis ANOVA was used followed by a post hoc Dunn’s multiple comparison test. Dot plot is used here and throughout the paper (dots, individual neurons; horizontal line, median; whiskers, interquartile range). Data is normalized to the median of the SomajRGECO1a values. (I–K) Averaged ΔF/F Ca2+ transients to one pulse (I), 10 pulses (J), and 160 pulses (K) by GECIs. All averaged traces are shown as mean ± s.e.m, indicated by solid lines and shaded area, respectively. Graph inset displays boxplot of peak ΔF/F0 of each GECI to applied action potentials. Statistics in C–E are the same as in F. (L) Peak ΔF/F0 of SomaFRCaMPi compared to other red GECIs as a function of pulses. (M) SNR of FRCaMPi compared to other red GECIs as a function of pulses. (N) Peak ΔF/F0 of SomaFRCaMPi compared to that of FRCaMPi as a function of pulses. Statistics in o for SomaFRCaMPi and FRCaMPi are the same as in J and Fig 1F, respectively. (O) Half the rise time of red GECIs as a function of pulses. (P) Half decay time of red GECIs as a function of pulses (SomaK-GECO1: n = 61 cells from 4 coverslips, 3 independent cultures; SomaXCaMP-R: n = 64 cells from 4 coverslips, 3 independent cultures; SomajRGECO1a: n = 100 cells from 6 coverslips, 4 independent cultures; SomaFRCaMPi: n = 148 cells from 7 coverslips, 4 independent cultures). Graph inset displays boxplot of half rise/decay time of each GECI after 10 action potentials. Box indicates the median and 25–75th percentile range, and the whiskers represent 1.5 times the interquartile range. See S5 Table for detailed statistics and exact p values. The quantitative data presented in this figure can be found in S1 Data. Created in BioRender, https://BioRender.com/e01g235.

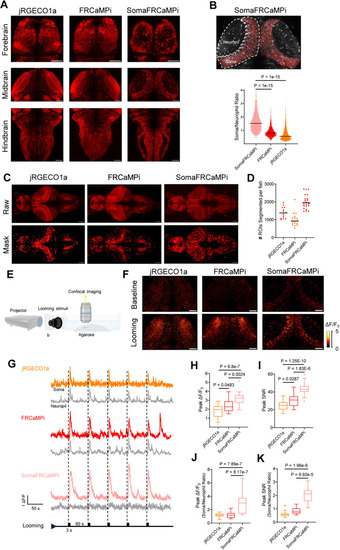
Expression and performance of jRGECO1a, FRCaMPi, and SomaFRCaMPi in reporting neuronal activities in zebrafish larvae.

(A) Representative single plane confocal images showing fore-, mid-, and hindbrain regions of live zebrafish larva expressing jRGECO1a, FRCaMPi, and SomaFRCaMPi in neurons driven by the HuC promoter (n = 10 fish at 6 dpf for each). (B) Representative single-plane confocal image of optical tectum showing the segmentation of somatic and neuropil fluorescence (top) and plotted soma/neuropil ratio of fluorescence (bottom) (jRGECO1a: 2,597 cells from 6 fish; FRCaMPi: n = 1,826 cells from 6 fish; SomaFRCaMPi: n = 2,884 cells from 6 fish). (C) Representative max projection confocal images (top) and segmentation masks (bottom) by Cellpose (n = 14 fish for jRGECO1a, n = 16 fish for FRCaMPi, n = 23 fish for SomaFRCaMPi). (D) Number of ROIs detected per fish larva in Cellpose (n = 14 fish for jRGECO1a, n = 16 fish for FRCaMPi, n = 23 fish for SomaFRCaMPi). (E) Schematics of looming stimulation set up in which black expanding circular shadows projected in front of the larval zebrafish embedded in agarose gel. (F) Representative confocal images showing fluorescence response of optical tectum before and during looming stimulation periods (n = 3 fish each). (G) Representative single trial fluorescence traces of soma and neuropil region of red GECI-expressing neurons during looming stimulation shown as ticks (n = 18 cells from 3 fish each). (H–K) Peak ΔF/F0(H), peak SNR at neuronal soma (I), soma-to-neuropil peak ΔF/F0 ratio (J), and soma-to-neuropil peak SNR ratio (K) of the fluorescence response during looming stimulation (n = 18 cells from 3 fish each). One-way ANOVA test was used, followed by a post hoc Tukey test. The Shapiro–Wilk test was used for the normal distribution test. Scale bar, 50 μm. In dot plots, dots are individual data points; the line denotes the median. Box indicates the median and 25–75th percentile range, and the whiskers represent 1.5 times the interquartile range. The quantitative data presented in this figure can be found in S1 Data. Created in BioRender, https://BioRender.com/q72h354.

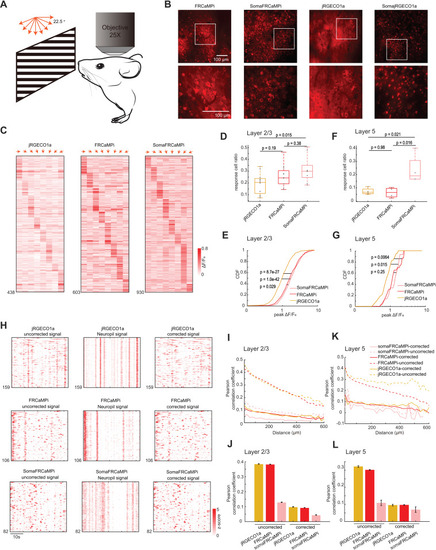
In vivo neural population imaging in mice V1 cortex.

(A) Schematics of the imaging experiment with drifting grating visual stimulation. (B) Representative single-plane two-photon images of V1 neurons expressing FRCaMPi, SomaFRCaMPi, jRGECO1a, and SomajRGECO1a (FRCaMPi: n = 20 FOVs from 5 mice; SomaFRCaMPi: n = 16 FOVs from 4 mice; jRGECO1a: n = 20 FOVs from 5 mice; SomajRGECO1a: n = 14 FOVs from 5 mice). (C) Trial averaged response amplitudes of single responsive neurons in V1 for different angles of drifting gratings indicated by red arrows. (D) Box plot of fraction of recorded V1 neurons responding to moving grating stimuli (jRGECO1a, n = 12 FOVs from 5 mice; FRCaMPi, n = 12 FOVs from 5 mice; SomaFRCaMPi, n = 9 FOVs from 3 mice) (E). Cumulative distribution function of neural response (ΔF/F0) to the preferred stimuli for V1 layer 2/3 (L2/3) neurons (jRGECO1a: n = 438 cells from 5 mice; FRCaMPi: n = 609 cells from 5 mice; SomaFRCaMPi: n = 930 cells from 3 mouse). Two-sample Kolmogorov–Smirnov test was used. Central line inside the box, median; box, interquartile range; whiskers, maximum and minimum; outliers, individual data points. One-way ANOVA test was used followed by Tukey’s multiple comparison. (F and G). Same as (D) and (E) but for V1 layer 5 (L5) neurons. n = 23 cells, 4 FOVs from 2 mice (jRGECO1a), 23 cells, 4 FOVs from 2 mice (FRCaMPi), and 15 cells, 4 FOVs from 2 mice (SomaFRCaMPi). Two-sample Kolmogorov–Smirnov test was used. (H) Spontaneous calcium activity of V1 neurons expressing jRGECO1a, FRCaMPi, and SomaFRCaMPi from representative sessions. Calcium traces of either uncorrected (left), neuropil signal (middle), or corrected with surrounding neuropil signal subtraction (right). (I) Correlation coefficients of spontaneous calcium activities between pairs of V1 L2/3 neurons plotted against the centroid distance (jRGECO1a: n = 82,765 neuron pairs from 4 mice; FRCaMPi: n = 310,392 neuron pairs from 4 mice; SomaFRCaMPi: n = 50,355 neuron pairs from 4 mice). (J) Correlation coefficients of spontaneous calcium activities between pairs of V1 L2/3 neurons that are within 100 μm for data shown in (H). (K and L) Same as (H) and (I), but for V1 L5 neuron pairs (jRGECO1a: n = 24,220 neuron pairs from 3 mice; FRCaMPi: n = 114,782 neuron pairs from 3 mice; SomaFRCaMPi: n = 1,721 neuron pairs from 3 mice). The quantitative data presented in this figure can be found in S1 Data.

Dual-color in vivo calcium imaging of NTS tuning during gastric distension.

(A) Schematics depicting NTS two-photon calcium imaging setup during gastric distension. (B) Representative two-photon NTS images showing the co-expressing of RiboL1-jGCaMP8s and SomaFRCaMPi with the shared ROIs identified from Cellpose segmentation. Scale bar, 50 μm. (C and D) Heat maps depicting time-resolved responses to a series of gastric distensions from NTS neurons co-expressing Ribo-GCaMP8s (C) and SomaFRCaMPi (D) from the image in (B) (329 neurons). (E) Scatter plot showing the peak ΔF/F of green (Ribo-GCaMP8s) and red (SomaFRCaMPi) calcium responses from NTS neurons co-expressing both indicators during gastric distension. (F–G) Similar to (E), but for noise evaluation (F) and peak Z-score analysis (G). n = 1,580 neurons from 2 mice. The grey diagonal dash represents a slope equal to 1, and the black dashed line denotes the linear fit of the data. The quantitative data presented in this figure can be found in S1 Data.

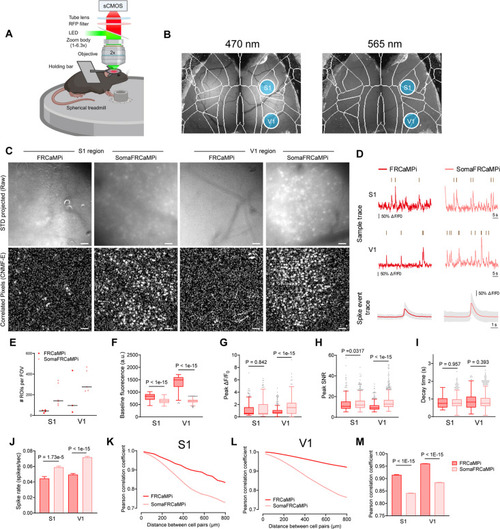
Recording of FRCaMPi and SomaFRCaMPi dynamics in

S1and V1 using wide-field microscopy.(A) Schematics of the wide-field one photon imaging experiment in awake resting mice. (B) Representative macroscopic images showing pan-cortical expression of gGRAB5-HT3.0 excited by 470 nm (left) and SomaFRCaMPi excited by 565 nm (right) (n = 4 mice). (C) Representative images (the standard deviation of images from one imaging session) for the S1 or V1 region in either SomaFRCaMPi- or FRCaMPi-expressing mice (top) and the corresponding correlation image by CNMF-E (bottom) (n = 4 mice each). (D) Top, representative calcium fluorescence traces with calcium events identified for FRCaMPi and SomaFRCaMPi from the experiments shown in (C) (n = 249 neurons from 5 FRCaMPi mice and n = 1,081 neurons from 5 SomaFRCaMPi mice). Bottom, aligned calcium events displayed as mean and S.D. (E) Number of ROIs detected per FOV by CNMF-E (S1: n = 4 FOVs from 4 FRCaMPi mice, n = 6 FOVs from SomaFRCaMPi 4 mice; V1: n = 3 FOVs from 3 FRCaMPi mice and n = 5 FOVs from 5 SomaFRCaMPi mice). In dot plots, line denotes median. (F–H) Baseline brightness (F), peak ΔF/F0(G), and peak SNR (H) of SomaFRCaMPi compared to FRCaMPi in S1 and V1 (S1: n = 161 neurons from 4 FRCaMPi mice, n = 1,143 neurons from 4 SomaFRCaMPi mice. V1: n = 563 neurons from 3 FRCaMPi mice, n = 1,653 neurons from 5 SomaFRCaMPi mice). (I) The decay time of SomaFRCaMPi compared to FRCaMPi in S1 and V1 (S1: n = 56 neurons from 4 FRCaMPi mice, n = 595 neurons from 4 SomaFRCaMPi mice. V1: n = 343 neurons from 3 FRCaMPi mice, n = 1,247 neurons from 5 SomaFRCaMPi mice). (J) Spike rate of SomaFRCaMPi compared to FRCaMPi in S1 and V1 (S1: n = 37 neurons from 4 FRCaMPi mice, n = 364 neurons from 4 SomaFRCaMPi mice. V1: n = 212 neurons from 3 FRCaMPi mice, n = 717 neurons from 5 SomaFRCaMPi mice). (K) Pearson correlation coefficient of calcium dynamics plotted against distance for different cell pairs from S1 region of mice expressing FRCaMPi (n = 3,410 cell pairs from 5 mice) or SomaFRCaMPi (n = 136,576 cell pairs from 4 mice). (L) As in K but for V1 (n = 99,451 cell pairs from 3 FRCaMPi mice and n = 296,784 cell pairs from 5 SomaFRCaMPi mice). (M) Pearson correlation coefficient of calcium dynamics between pairs of neurons within 800 μm. Statistics are the same as in K and L. Mann–Whitney U test. Scale bar, 50 μm. Bar chart is shown as mean ± s.e.m. Box indicates the median and 25–75th percentile range, and the whiskers represent 1.5 times the interquartile range. Spike rate and Pearson correlation coefficient are plotted as bars to aid the demonstration of data distribution. See S6 Table for more details. The quantitative data presented in this figure can be found in S1 Data. Created in BioRender,.https://BioRender.com/t42r557.

Acknowledgments
This image is the copyrighted work of the attributed author or publisher, and ZFIN has permission only to display this image to its users. Additional permissions should be obtained from the applicable author or publisher of the image. Full text @ PLoS Biol.