IMAGE

Fig 5

ID
ZDB-IMAGE-250501-55
Source
Figures for Zhou et al., 2025
Image
Figure Caption

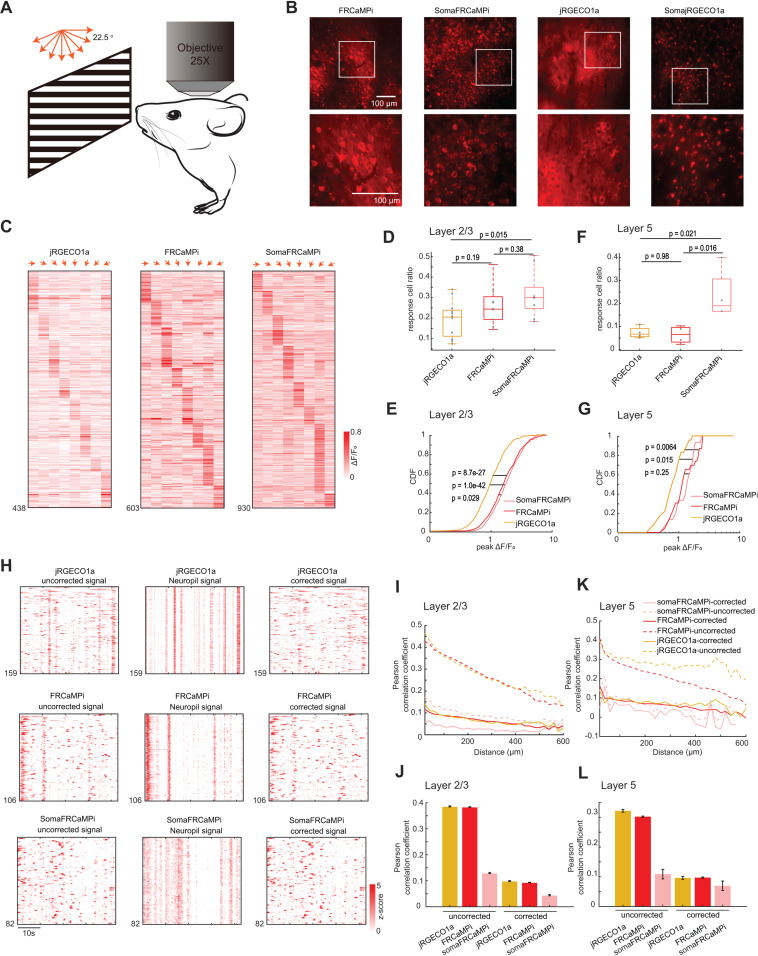
Fig 5 In vivo neural population imaging in mice V1 cortex.

(A) Schematics of the imaging experiment with drifting grating visual stimulation. (B) Representative single-plane two-photon images of V1 neurons expressing FRCaMPi, SomaFRCaMPi, jRGECO1a, and SomajRGECO1a (FRCaMPi: n = 20 FOVs from 5 mice; SomaFRCaMPi: n = 16 FOVs from 4 mice; jRGECO1a: n = 20 FOVs from 5 mice; SomajRGECO1a: n = 14 FOVs from 5 mice). (C) Trial averaged response amplitudes of single responsive neurons in V1 for different angles of drifting gratings indicated by red arrows. (D) Box plot of fraction of recorded V1 neurons responding to moving grating stimuli (jRGECO1a, n = 12 FOVs from 5 mice; FRCaMPi, n = 12 FOVs from 5 mice; SomaFRCaMPi, n = 9 FOVs from 3 mice) (E). Cumulative distribution function of neural response (ΔF/F0) to the preferred stimuli for V1 layer 2/3 (L2/3) neurons (jRGECO1a: n = 438 cells from 5 mice; FRCaMPi: n = 609 cells from 5 mice; SomaFRCaMPi: n = 930 cells from 3 mouse). Two-sample Kolmogorov–Smirnov test was used. Central line inside the box, median; box, interquartile range; whiskers, maximum and minimum; outliers, individual data points. One-way ANOVA test was used followed by Tukey’s multiple comparison. (F and G). Same as (D) and (E) but for V1 layer 5 (L5) neurons. n = 23 cells, 4 FOVs from 2 mice (jRGECO1a), 23 cells, 4 FOVs from 2 mice (FRCaMPi), and 15 cells, 4 FOVs from 2 mice (SomaFRCaMPi). Two-sample Kolmogorov–Smirnov test was used. (H) Spontaneous calcium activity of V1 neurons expressing jRGECO1a, FRCaMPi, and SomaFRCaMPi from representative sessions. Calcium traces of either uncorrected (left), neuropil signal (middle), or corrected with surrounding neuropil signal subtraction (right). (I) Correlation coefficients of spontaneous calcium activities between pairs of V1 L2/3 neurons plotted against the centroid distance (jRGECO1a: n = 82,765 neuron pairs from 4 mice; FRCaMPi: n = 310,392 neuron pairs from 4 mice; SomaFRCaMPi: n = 50,355 neuron pairs from 4 mice). (J) Correlation coefficients of spontaneous calcium activities between pairs of V1 L2/3 neurons that are within 100 μm for data shown in (H). (K and L) Same as (H) and (I), but for V1 L5 neuron pairs (jRGECO1a: n = 24,220 neuron pairs from 3 mice; FRCaMPi: n = 114,782 neuron pairs from 3 mice; SomaFRCaMPi: n = 1,721 neuron pairs from 3 mice). The quantitative data presented in this figure can be found in S1 Data.

Acknowledgments
This image is the copyrighted work of the attributed author or publisher, and ZFIN has permission only to display this image to its users. Additional permissions should be obtained from the applicable author or publisher of the image. Full text @ PLoS Biol.