IMAGE

Fig 6

ID
ZDB-IMAGE-250501-56
Source
Figures for Zhou et al., 2025
Image
Figure Caption

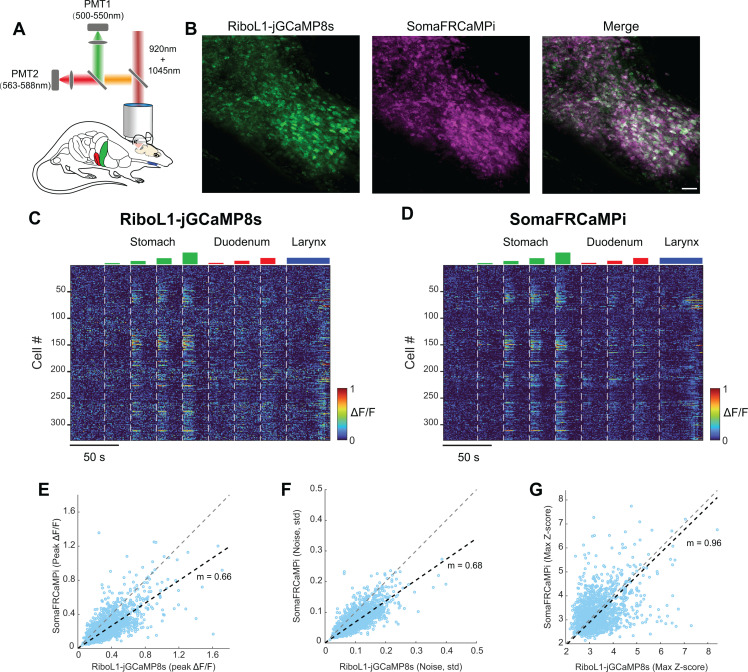
Fig 6 Dual-color in vivo calcium imaging of NTS tuning during gastric distension.

(A) Schematics depicting NTS two-photon calcium imaging setup during gastric distension. (B) Representative two-photon NTS images showing the co-expressing of RiboL1-jGCaMP8s and SomaFRCaMPi with the shared ROIs identified from Cellpose segmentation. Scale bar, 50 μm. (C and D) Heat maps depicting time-resolved responses to a series of gastric distensions from NTS neurons co-expressing Ribo-GCaMP8s (C) and SomaFRCaMPi (D) from the image in (B) (329 neurons). (E) Scatter plot showing the peak ΔF/F of green (Ribo-GCaMP8s) and red (SomaFRCaMPi) calcium responses from NTS neurons co-expressing both indicators during gastric distension. (F–G) Similar to (E), but for noise evaluation (F) and peak Z-score analysis (G). n = 1,580 neurons from 2 mice. The grey diagonal dash represents a slope equal to 1, and the black dashed line denotes the linear fit of the data. The quantitative data presented in this figure can be found in S1 Data.

Acknowledgments
This image is the copyrighted work of the attributed author or publisher, and ZFIN has permission only to display this image to its users. Additional permissions should be obtained from the applicable author or publisher of the image. Full text @ PLoS Biol.