|
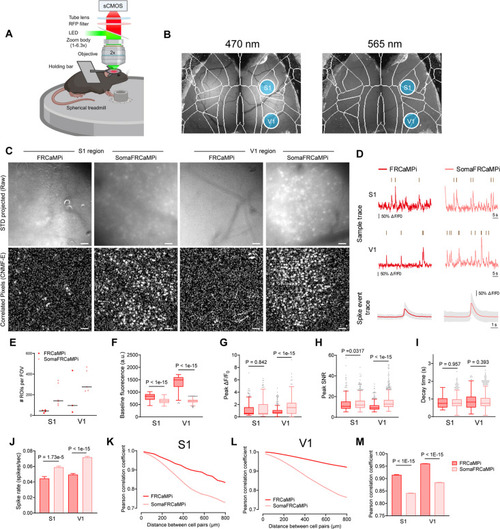
Recording of FRCaMPi and SomaFRCaMPi dynamics in S1and V1 using wide-field microscopy.(A) Schematics of the wide-field one photon imaging experiment in awake resting mice. (B) Representative macroscopic images showing pan-cortical expression of gGRAB5-HT3.0 excited by 470 nm (left) and SomaFRCaMPi excited by 565 nm (right) (n = 4 mice). (C) Representative images (the standard deviation of images from one imaging session) for the S1 or V1 region in either SomaFRCaMPi- or FRCaMPi-expressing mice (top) and the corresponding correlation image by CNMF-E (bottom) (n = 4 mice each). (D) Top, representative calcium fluorescence traces with calcium events identified for FRCaMPi and SomaFRCaMPi from the experiments shown in (C) (n = 249 neurons from 5 FRCaMPi mice and n = 1,081 neurons from 5 SomaFRCaMPi mice). Bottom, aligned calcium events displayed as mean and S.D. (E) Number of ROIs detected per FOV by CNMF-E (S1: n = 4 FOVs from 4 FRCaMPi mice, n = 6 FOVs from SomaFRCaMPi 4 mice; V1: n = 3 FOVs from 3 FRCaMPi mice and n = 5 FOVs from 5 SomaFRCaMPi mice). In dot plots, line denotes median. (F–H) Baseline brightness (F), peak ΔF/F0(G), and peak SNR (H) of SomaFRCaMPi compared to FRCaMPi in S1 and V1 (S1: n = 161 neurons from 4 FRCaMPi mice, n = 1,143 neurons from 4 SomaFRCaMPi mice. V1: n = 563 neurons from 3 FRCaMPi mice, n = 1,653 neurons from 5 SomaFRCaMPi mice). (I) The decay time of SomaFRCaMPi compared to FRCaMPi in S1 and V1 (S1: n = 56 neurons from 4 FRCaMPi mice, n = 595 neurons from 4 SomaFRCaMPi mice. V1: n = 343 neurons from 3 FRCaMPi mice, n = 1,247 neurons from 5 SomaFRCaMPi mice). (J) Spike rate of SomaFRCaMPi compared to FRCaMPi in S1 and V1 (S1: n = 37 neurons from 4 FRCaMPi mice, n = 364 neurons from 4 SomaFRCaMPi mice. V1: n = 212 neurons from 3 FRCaMPi mice, n = 717 neurons from 5 SomaFRCaMPi mice). (K) Pearson correlation coefficient of calcium dynamics plotted against distance for different cell pairs from S1 region of mice expressing FRCaMPi (n = 3,410 cell pairs from 5 mice) or SomaFRCaMPi (n = 136,576 cell pairs from 4 mice). (L) As in K but for V1 (n = 99,451 cell pairs from 3 FRCaMPi mice and n = 296,784 cell pairs from 5 SomaFRCaMPi mice). (M) Pearson correlation coefficient of calcium dynamics between pairs of neurons within 800 μm. Statistics are the same as in K and L. Mann–Whitney U test. Scale bar, 50 μm. Bar chart is shown as mean ± s.e.m. Box indicates the median and 25–75th percentile range, and the whiskers represent 1.5 times the interquartile range. Spike rate and Pearson correlation coefficient are plotted as bars to aid the demonstration of data distribution. See S6 Table for more details. The quantitative data presented in this figure can be found in S1 Data. Created in BioRender,.https://BioRender.com/t42r557.
|