
- Title
-
A zebrafish model of intestinal epithelial damage reveals macrophages and igfbp1a as major modulators of mucosal healing
- Authors
- Morales Castro, R.A., Kern, B.C., Díaz-Basabe, A., Meinen, E.R., Zhao, D., Zhou, Y., Castillo, F., Monasterio, G., Farcas, V., Chávez, M.N., Fransson, J., Villablanca, E.J.
- Source
- Full text @ Mucosal Immunol
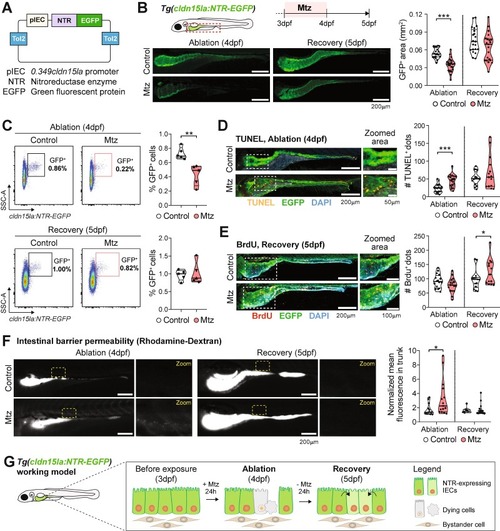
Loss and recovery of GFP+ IECs after Mtz treatments of the Tg(cldn15la:NTR-EGFP) reporter. (A) Generated plasmid containing the 0.349cldn15la promoter upstream Nitroreductase (NTR) and EGFP fusion protein. (B) Changes in the GFP+ intestinal area during Mtz-induced ablation (4dpf) and recovery (5dpf). Scale bar = 200 µm. Pooled data from 3 independent experiments (1 dot = 1 larva). (C) Whole-larva flow cytometry analysis of control and Mtz-treated larvae during ablation and regeneration. Each dot represents 1 independent experiment (1 dot = pool of 10 larvae, 5 independent experiments conducted). (D) Apoptosis analyses by whole-mount terminal deoxynucleotidyl transferase dUTP nick end labeling (TUNEL) of Mtz-treated larvae. Scale bar = 200 µm in whole-intestine pictures and 50 µm in zoomed area. Pooled data from 2 independent experiments (1 dot = 1 larva). (E) 5-bromo-2′-deoxyurinide (BrdU) incorporation in Mtz-treated larvae. Scale bar = 200 µm in whole-intestine pictures and 100 µm in zoomed area. Pooled data from 2 independent experiments (1 dot = 1 larva). (F) Intestinal permeability of control and Mtz-treated larvae assessed by oral gavage of rhodamine-dextran. Normalized mean fluorescence in the trunk was measured. Scale bar = 200 µm. Pooled data from 2 independent experiments (1 dot = 1 larva). (G) Working model. Different symbol shapes denote independent experiments in B, C, D, E, and F. Unpaired t-tests were performed in B, C, D, E and F to compare conditions at specified timepoints. *p < 0.05; ***p < 0.001. |
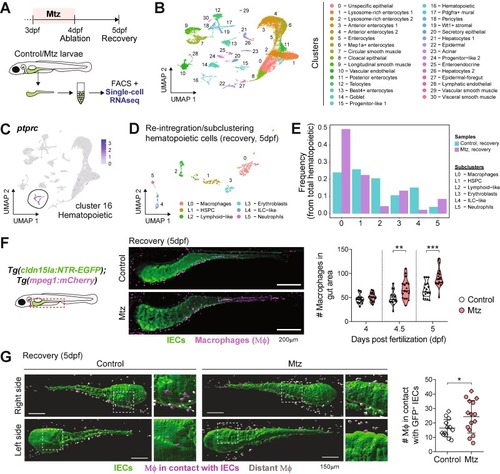
Macrophages (Μϕ) accumulate in the gut and interact with IEC during intestinal regeneration. (A) Experimental design for single-cell (sc)RNA-seq from dissected intestines of the Tg(cldn15la:NTR-EGFP). (B) UMAP reduction and clustering of intestinal cells collected during ablation (4dpf) and recovery (5dpf). (C) Identification of hematopoietic cells based on the expression of the pan-leukocyte marker ptprc. (D) UMAP reduction and subclustering of hematopoietic cells (cluster 16) during intestinal recovery. (E) Frequency of identified hematopoietic subclusters during intestinal recovery. (F) Recruitment of Μϕ to the gut after Mtz treatments in double transgenic Tg(cldn15la:NTR-EGFP); Tg(mpeg1:mCherry) larvae. Scale bar = 200 µm. Pooled data from 2 independent experiments (1 dot = 1 larva). (G) Light-sheet imaging of the intestines of Tg(cldn15la:NTR-EGFP); Tg(mpeg1:Cherry) larvae and analysis of Μϕ (mCherry+ cells) interacting with IEC (GFP+ cells). Scale bar = 150 µm. Each dot represents 1 larva at the studied timepoint. Pooled data from 2 independent experiments (1 dot = 1 larva). Different symbol shapes denote independent experiments in the graphs from F and G. Unpaired t-tests were performed in F and G to compare conditions at indicated timepoints. *p < 0.05; **p < 0.01; ***p < 0.001. |
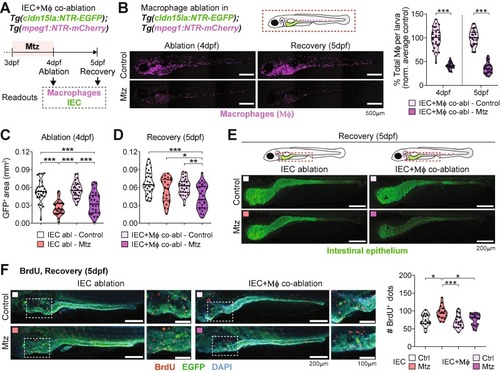
Depletion of macrophages (Μϕ) impairs intestinal regeneration. (A) Experimental design for the co-ablation of Μϕ and IECs in zebrafish larvae in the double reporter Tg(cldn15la:NTR-EGFP; mpeg1:NTR-mCherry). (B) Μϕ depletion efficiency (in percentage) of IEC + Μϕ co-ablated group after Mtz treatments. Scale bar = 500 µm. Pooled data of 3 independent experiments are shown (1 dot = 1 larva). (C-D) GFP+ area measurements in control and Mtz-treated IEC- and IEC + Μϕ co-ablated reporter larvae during (C) ablation and (D) recovery. Pooled data from 3 independent experiments are shown (1 dot = 1 larva). (E) Representative images of intestines from the IEC- and co-ablation groups during recovery (5dpf). Scale bar = 200 µm. (F) 5-bromo-2′-deoxyurinide (BrdU) incorporation in control and Mtz-treated IEC-ablated and IEC + Μϕ co-ablated groups of larvae. Scale bar = 200 µm in whole-intestine pictures and 100 µm in zoomed area. Pooled data from 2 independent experiments (1 dot = 1 larva). Different symbol shapes denote independent experiments in B, C, D, and F. Unpaired t-tests were performed per timepoint in B, Krushall-Wallis tests with Dunn’s multiple comparisons were performed in C and D, and one-way ANOVA with Tukey’s post-tests was performed in F. *p < 0.05; **p < 0.01; ***p < 0.001. |
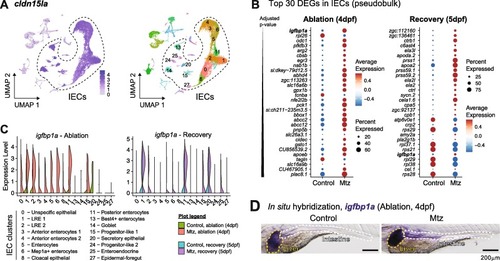
Expression of igfbp1a by IEC upon Mtz-induced intestinal damage. (A) Selection of IEC clusters based on cldn15la expression. (B) Top 30 differentially expressed genes (DEG) on IEC clusters during intestinal ablation and recovery in larval zebrafish. (C) Expression of igfbp1a in IEC clusters during Mtz-induced damage and recovery. (D) Representative pictures of whole-mount in situ hybridization against igfbp1a in control and Mtz-treated larvae during ablation. Scale bar = 200 µm. |
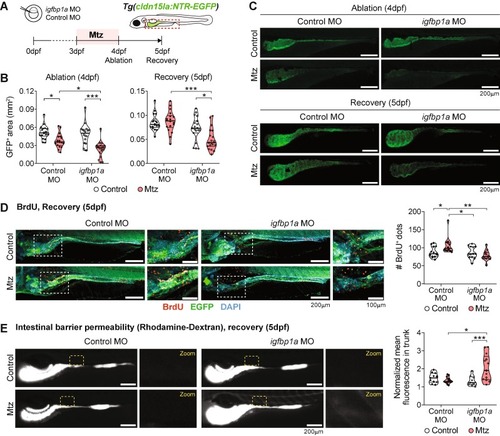
Knockdown of igfbp1a affects intestinal regeneration after Mtz-induced damage. (A) Experimental design for morpholino-mediated knockdown experiments. (B) GFP+ intestinal area measurements in control and igfbp1a morphants during ablation and recovery. Pooled data from 2 independent experiments are shown (1 dot = 1 larva). (C) Representative confocal images of the intestines of analyzed groups. Scale bar = 200 µm. (D) BrdU incorporation in control and igfbp1a morphants during recovery (5dpf). Scale bar = 200 µm in whole-intestine pictures and 100 µm in zoomed area. Pooled data from 2 independent experiments (1 dot = 1 larva). (E) Intestinal permeability of control and igfbp1a morphants during recovery (5dpf) assessed by oral gavage of rhodamine-dextran. Normalized mean fluorescence in the trunk was measured. Scale bar = 200 µm. Pooled data from 2 independent experiments (1 dot = 1 larva). Different symbol shapes denote independent experiments in B, D, and E. Two-way ANOVA with Tukey’s post-tests were performed in B, D, and E. *p < 0.05; ***p < 0.001. |