
|
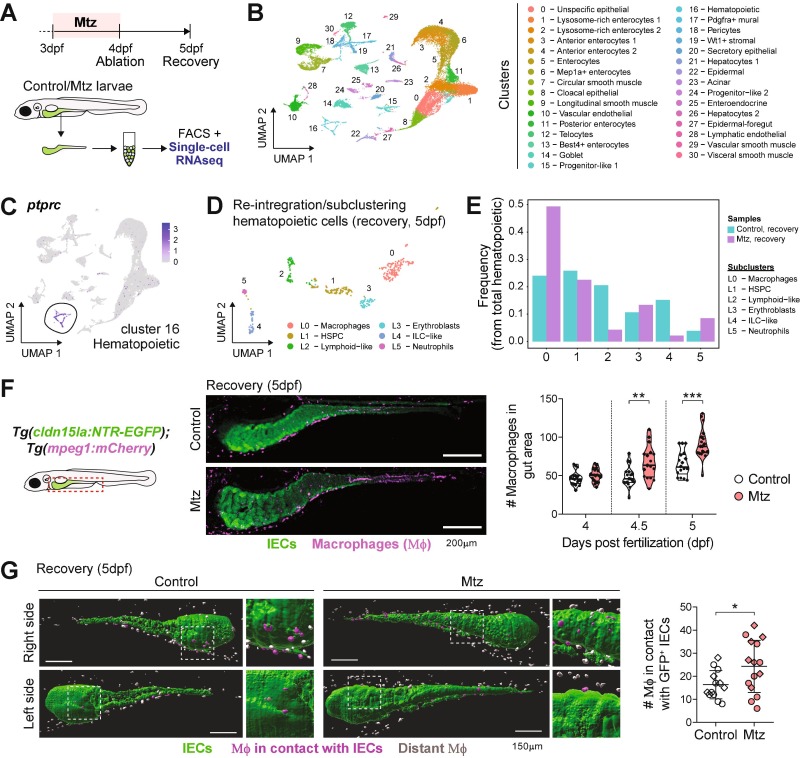
Fig. 2 Macrophages (Μϕ) accumulate in the gut and interact with IEC during intestinal regeneration. (A) Experimental design for single-cell (sc)RNA-seq from dissected intestines of the Tg(cldn15la:NTR-EGFP). (B) UMAP reduction and clustering of intestinal cells collected during ablation (4dpf) and recovery (5dpf). (C) Identification of hematopoietic cells based on the expression of the pan-leukocyte marker ptprc. (D) UMAP reduction and subclustering of hematopoietic cells (cluster 16) during intestinal recovery. (E) Frequency of identified hematopoietic subclusters during intestinal recovery. (F) Recruitment of Μϕ to the gut after Mtz treatments in double transgenic Tg(cldn15la:NTR-EGFP); Tg(mpeg1:mCherry) larvae. Scale bar = 200 µm. Pooled data from 2 independent experiments (1 dot = 1 larva). (G) Light-sheet imaging of the intestines of Tg(cldn15la:NTR-EGFP); Tg(mpeg1:Cherry) larvae and analysis of Μϕ (mCherry+ cells) interacting with IEC (GFP+ cells). Scale bar = 150 µm. Each dot represents 1 larva at the studied timepoint. Pooled data from 2 independent experiments (1 dot = 1 larva). Different symbol shapes denote independent experiments in the graphs from F and G. Unpaired t-tests were performed in F and G to compare conditions at indicated timepoints. *p < 0.05; **p < 0.01; ***p < 0.001.