
- Title
-
Total flavonoids of litchi seed inhibit breast cancer metastasis by regulating the PI3K/AKT/mTOR and MAPKs signaling pathways
- Authors
- Yang, X., Liu, S., Liu, Y., Wang, Y., Cui, D., Lan, T., Zhu, D., Su, Z., Hao, E., Qin, L., Guo, H.
- Source
- Full text @ Pharm Biol

TFLS inhibits the viability of breast cancer cells. (A, B) Viability of MDA-MB-231 and MDA-MB-468 cells treated with various concentrations of TFLS (0–160 μg/mL) for 24, 48 and 72 h, assessed using the CCK-8 assay. Data are presented as mean ± SD. (C) Morphological changes in MDA-MB-231 and MDA-MB-468 cells treated with 0, 40, 80 and 160 μg/mL of TFLS for 72 h, visualized under microscopy (scale bar: 50 μm). |

TFLS inhibits the migration and invasion of breast cancer cells. (A, B) Effects of TFLS on the migration of MDA-MB-231 and MDA-MB-468 cells, analyzed via wound-healing assay (scale bar: 200 μm). (C) Effects of TFLS on cell migration analyzed using transwell migration assay without matrigel (scale bar: 50 μm). (D) Effects of TFLS on cell invasion assessed via transwell invasion assay with matrigel (scale bar: 20 μm). Cells were imaged under light microscopy, and counts were performed in five random fields. Data are presented as mean ± SD. **p < 0.01 compared to the control group. |

TFLS inhibits the EMT of breast cancer cells. (A) Morphological changes in MDA-MB-231 and MDA-MB-468 cells after TFLS treatment for 72 h (scale bar: 50 μm). (B, C) Western blot analysis of EMT-associated protein expression, including E-cadherin, N-cadherin, and snail, in MDA-MB-231 and MDA-MB-468 cells. Data are presented as mean ± SD. *p < 0.05, **p < 0.01 compared to the control group. |
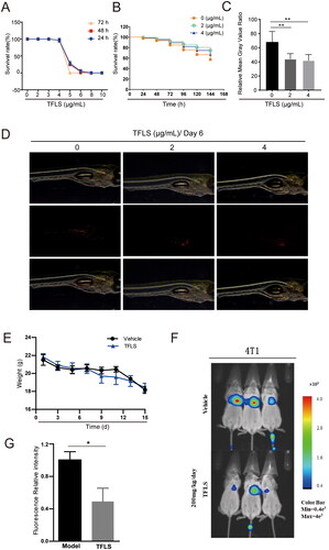
TFLS inhibits breast cancer cell metastasis in zebrafish and mouse models. (A) Zebrafish toxicity tests for determining the maximum safe concentration of TFLS. (B) Survival curves of zebrafish treated with TFLS. (C) Fluorescence intensity of MDA-MB-231 cells in zebrafish after six days of treatment. (D) Distribution of breast cancer cells in zebrafish following six days of TFLS intervention, with red fluorescence representing MDA-MB-231 cells. (E) Body weight curves of mice in TFLS-treated and model groups. (F) Bioluminescence imaging of 4T1−luc cells in mice at the end of the experiment. (G) Quantitative bar plot of fluorescence intensity of 4T1−luc cells in mice at the experiment’s conclusion. Data are presented as mean ± SEM. *p < 0.05, **p < 0.01 compared to the model group. |
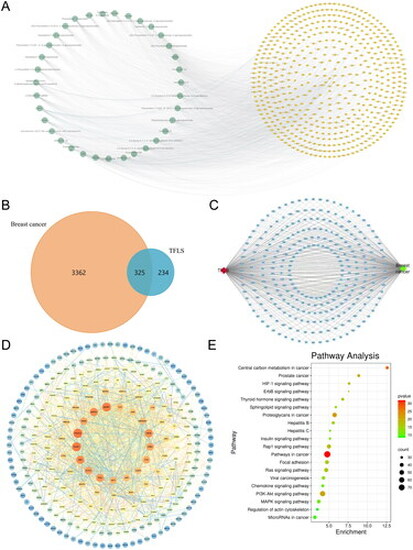
Network pharmacology prediction results. (A) Compound-target network. Green nodes (left) represent 36 flavonoid compounds from litchi seeds, while yellow nodes (right) correspond to the 559 targets associated with these compounds. (B) Venn diagram showing 325 overlapping genes between the 559 potential therapeutic targets of TFLS and 3687 breast cancer-related genes. (C) Compound-disease-shared targets network. Red nodes represent TFLS, green nodes represent breast cancer, and blue square nodes indicate the 325 overlapping genes. (D) PPI network of the common targets. The diagram illustrates interactions among the 325 overlapping targets. Node sizes range from large to small based on degree of freedom, with the 36 key targets located in the inner two circles. (E) Top 20 KEGG pathways enriched from the 36 key targets. |
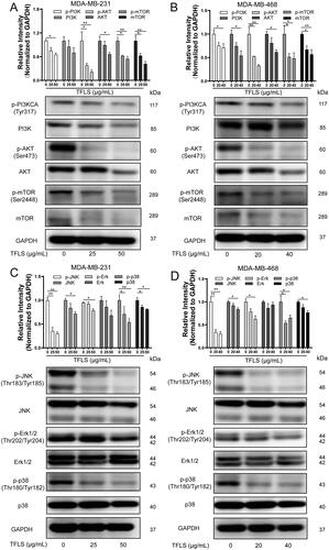
TFLS suppresses the PI3K/AKT/mTOR and MAPK signaling in breast cancer cells. (A, B) Western blot analysis of PI3K, AKT, and mTOR expression and activity in MDA-MB-231 and MDA-MB-468 cells treated with TFLS for 72 h. (C, D) Western blot analysis of JNK, Erk1/2, and p38 expression and activity in MDA-MB-231 and MDA-MB-468 cells treated with TFLS for 72 h. Data are presented as mean ± SD. *p < 0.05, **p < 0.01 compared to the control group |
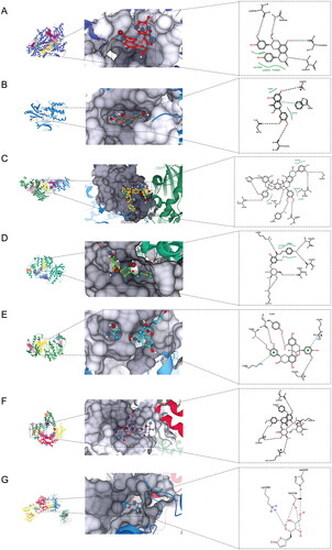
Binding modes of TFLS compounds with target proteins. For target proteins lacking their native ligands, potential binding pockets were scored by SeeSAR during docking based on DoGSiteScorer. The yellow area (pocket 1) indicates the highest score, the red area (pocket 2) indicates the second highest, and the green area (pocket 3) indicates the lowest score. (A) Binding mode of epicatechin-(7,8-bc)-4β-(4-hydroxyphenyl)-dihydro-2(3H)-pyranone with PI3K. (B) Binding mode of quercetin with AKT1. (C) Binding mode of litchitannin A2 with ERK1. (D) The binding mode of dihydrochalcone-4′-O-β-D-glucopyranoside and ERK2; (E) The binding mode of procyanidin A2 and p38; (F) The binding mode of tamarixetin 3-O-rutinoside and mTOR. (G) The binding mode of litchiol B and JNK3. |
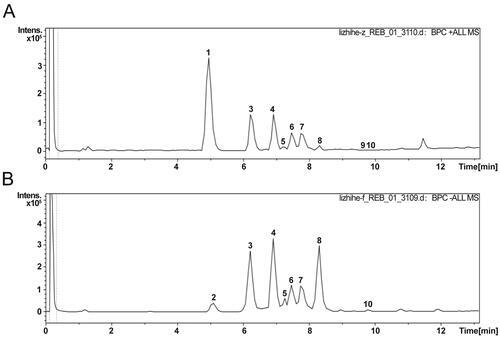
The characterization of TFLS chemical profile. (A) Positive ion mode. (B) Negative ion mode. 1: Unknown (C12H17NO2); 2: 2,5-Dihydroxybenzoic acid; 3: 3-O-p-coumaroylquinic acid; 4: Epicatechin; 5: Rutin; 6: Proanthocyanidin A1; 7: Proanthocyanidin A2; 8: Litchioside C; 9: Berberine; 10: (-)-pinocembrin 7-O-Neohesperidoside. |