
Image
|
Figure Caption
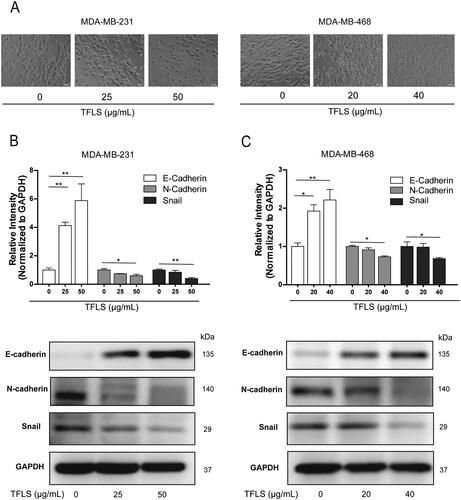
Fig. 3 TFLS inhibits the EMT of breast cancer cells. (A) Morphological changes in MDA-MB-231 and MDA-MB-468 cells after TFLS treatment for 72 h (scale bar: 50 μm). (B, C) Western blot analysis of EMT-associated protein expression, including E-cadherin, N-cadherin, and snail, in MDA-MB-231 and MDA-MB-468 cells. Data are presented as mean ± SD. *p < 0.05, **p < 0.01 compared to the control group.
Acknowledgments
This image is the copyrighted work of the attributed author or publisher, and
ZFIN has permission only to display this image to its users.
Additional permissions should be obtained from the applicable author or publisher of the image.
Full text @ Pharm Biol