
Image
|
Figure Caption
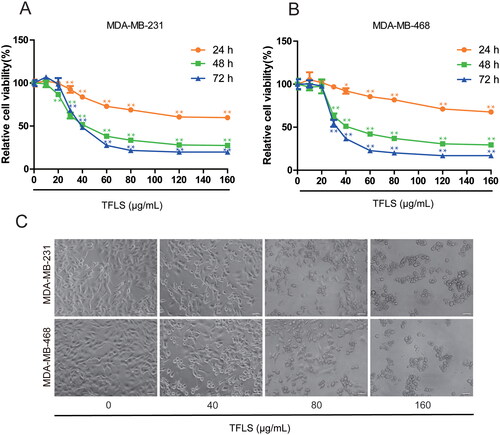
Fig. 1 TFLS inhibits the viability of breast cancer cells. (A, B) Viability of MDA-MB-231 and MDA-MB-468 cells treated with various concentrations of TFLS (0–160 μg/mL) for 24, 48 and 72 h, assessed using the CCK-8 assay. Data are presented as mean ± SD. (C) Morphological changes in MDA-MB-231 and MDA-MB-468 cells treated with 0, 40, 80 and 160 μg/mL of TFLS for 72 h, visualized under microscopy (scale bar: 50 μm).
Acknowledgments
This image is the copyrighted work of the attributed author or publisher, and
ZFIN has permission only to display this image to its users.
Additional permissions should be obtained from the applicable author or publisher of the image.
Full text @ Pharm Biol