
- Title
-
Transcriptomic and morphologic vascular aberrations underlying FCDIIb etiology
- Authors
- Fang, C., Zhang, X., Yang, L., Sun, L., Lu, Y., Liu, Y., Guo, J., Wang, M., Tan, Y., Zhang, J., Gao, X., Zhu, L., Liu, G., Ren, M., Xiao, J., Zhang, F., Ma, S., Zhao, R., Mei, X., Qi, D.
- Source
- Full text @ Nat. Commun.

Overview of cell types in the Neocortex of FCDIIb Patients. a Schematic representation of experimental workflow of droplet-based snRNA-seq on FCDIIb neocortex biopsies using 10X genomics. A total of 15 pairs of lesion/adjacent brain neocortex samples were obtained from 15 FCDIIb patients. Red dots indicate the lesion sites. b UMAP visualization of snRNA-seq transcriptomic profiles from (a), showing the overall annotation of 24 major cell types. Different colors represent distinct cell types. IN interneuron, PN projection neuron, GC glial cell, VC vasculature cell, AST astrocyte, Olig oligodendrocyte, OPC oligodendrocyte precursor cell, SMC smooth muscle cell, EC endothelial cell; Micro microglia. c Dot plot illustrating the expression patterns of marker genes of Micro, EC, AST, OPC, Olig, and other cell types. Dot size represents the percentage of cells expressing each gene in the indicated clusters, and color intensity reflects normalized expression levels. Clusters correspond to those in (b). d Descriptive statistics of the nucleus counts were obtained for each cluster in (b). The Cellular composition of the FCDIIb neocortex mainly consists of GC, PN, IN, and VC, closely resembling the normal neocortex. e Percentage of nuclei in each cluster in the snRNA-seq data. Lesion/Adjacent: lesion/adjacent neocortex of FCDIIb. n = 15. Data are presented as median (center line) with interquartile range (Q1-Q3, interquartile range, IQR), extending to ±1.5×IQR from the box edges. P-value by two-tailed Wilcoxon matched-pairs signed rank test. Source data is provided as a Source Data file. f The AUC value from cell type prioritization analysis (CTPA) for each cluster. The Augur R package was used for CTPA, comparing lesion vs. adjacent conditions. |
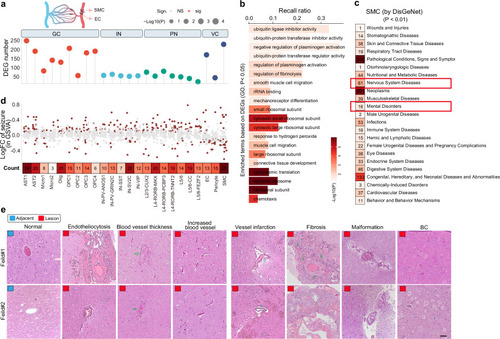
Vasculature aberration is a dominant feature of the neocortex of the FCDIIb lesions. a Differentially expressed genes (DEGs) in each cluster when comparing lesion and adjacent neocortex. DEGs were identified by differential state analysis, with a cutoff of |log2 fold change | >1.5 and P-value < 0.05. P-value was defined by the limma-voom-based method using the Muscat R package. IN interneuron, PN projection neuron, GC glial cell, VC vasculature cell. b Top 20 of DEG-based enriched gene ontology (GO) terms of SMCs. DEGs from (a) were used for enrichment analysis with a cutoff p-value < 0.05. P-value was defined by the Hypergeometric test using the Gprofiler2 R package. c Statistics of SMC-related human diseases. Significant terms were defined by pathway-based differential analysis based on the Empirical Bayes method using the Limma R package, with a cutoff of p-value < 0.01. The pathway enrichment score for DisGeNet gene sets was calculated using the GSVA algorithm. d Differentially expressed pathways (DEPs) in clusters from Fig. 1b using seizure/epilepsy-related gene sets. The GSVA algorithm was employed to transform the pseudo-bulk expression matrix into a pathway matrix. DEPs were identified using the Limma R package with a cutoff p-value < 0.05. The heatmap indicates the total number of DEPs. DEPs were defined by the Empirical Bayes method using the Limma R package. e Representative histological features of neocortexes as determined by HE staining. Each experiment was repeated independently 3 times. Normal/Lesion; adjacent/lesion neocortex of FCDIIb; arrows indicate typical features; scale bar, 50 μm. |
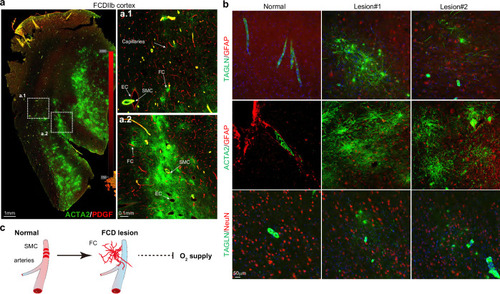
Firework cell: abnormal SMCs in FCDIIb. a Immunofluorescence (IF) staining for PDGF (red)/ACTA2 (green) in lesion neocortex sections of FCDIIb patients. The dashed square indicates a local magnification. Scale bar, 1 and 0.1 mm. b IF staining for GFAP (red), TAGLN (green), and ACTA2 (green) in neocortex sections from FCDIIb patients and the paired adjacent neocortex. Scale bar, 0.1 mm. c Schematic model representing vascular system aberration in lesion neocortex. SMCs detach from endothelial cells to form FCs, impairing the contractile function of blood vessels and reducing oxygen supply. FC firework cell, SMC smooth muscle cell. |
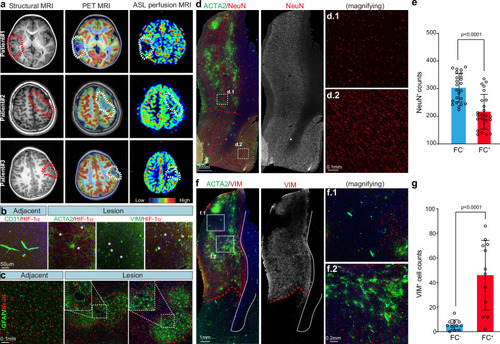
Local ischemia-hypoxia: the pathogenic contribution of vascular malformation. a Imaging presentations showing the lesion sites in FCDIIb patients. MRI reveals focal cortical dysplasia, including cortical malformation, thickened neocortex, and blurred gray and white matter interface. PET/MRI images show focal hypometabolism in the lesion area. ASL perfusion MRI demonstrates a focal decrease in cerebral blood flow in the lesion area. b Immunofluorescence (IF) staining for CD31, ACTA2, VIM, and HIF-1α in the lesion and adjacent neocortex sections of FCDIIb patients. The asterisk indicates HIF-1α+ cells. Each experiment was repeated independently 3 times. c IF staining for GFAP (green) and NeuN (red) in neocortex sections of FCDIIb patients. GFAP-labeled astrocytes form a typical astrocytic island (red dashed circle). The dashed square indicates a local magnification. d IF staining for ACTA2 (green) and NeuN (red) for neocortex sections of FCDIIb patients. The dashed square indicates a local magnification. The red dashed curve indicates the boundary between the low and deep layers. e Statistical analysis of the impact of FCs presence on neuron count. The number of neurons in FC+ regions is significantly lower compared to FC− regions. FC−/+, FC negative/positive region. The neuron number of 24 independent local sites (1 × 1 mm2) was counted. Data are presented as mean ± SD. P-value < 0.0001 by two-sided Student’s t-test. Source data is provided as a Source Data file. FC, firework cell. f IF staining for ACTA2 (green) and VIM (red) in lesion neocortex sections of FCDIIb patients and associated statistics. The dashed square indicates a local magnification. The red dashed curve indicates the boundary between the lesion and adjacent areas. g Statistical analysis of the impact of FCs presence on VIM+ cell count. Regions with a higher number of FC+ cells show a significantly greater number of VIM+ cells compared to regions with fewer FC+ cells. The neuron number of 12 independent local sites (2 × 2 mm2) was counted. Data are presented as mean ± SD. P-value < 0.0001 by two-sided Mann-Whitney nonparametric test. Source data is provided as a Source Data file. FC firework cell. |
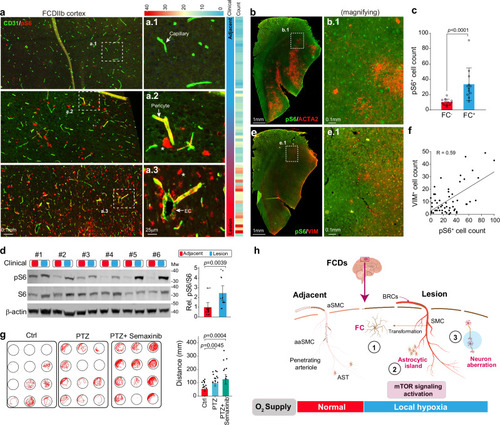
Vascular malformation contributes to seizure pathogenesis. a Immunofluorescence (IF) staining for CD31 and pS6 for neocortex sections of FCDIIb patients. The right panel shows a local magnification of the sections within the dashed box. EC, endothelial cell. b, c IF staining for ACTA2 and pS6 (b) in lesion neocortex sections from FCDIIb patients and corresponding statistics (c). The cell number of 12 independent local sites (1 × 1 mm2) was counted. Data are presented as mean ± SD. P-value < 0.0001 by two-sided Mann-Whitney nonparametric test. Source data is provided as a Source Data file. FC, firework cell. d Western blot analysis of the indicated protein pS6 and S6 expression levels in the neocortex of FCDIIb patients. Both lesion and paired adjacent neocortex samples were used. pS6: phosphorylated S6 protein. n = 18. Data are presented as mean ± SD. P-value = 0.0039 by two-sided paired t-test. Mw, molecular weight. Source data is provided as a Source Data file. e, f IF staining for ACTA2 and VIM (e) in lesion neocortex sections from FCDIIb patients and associated statistics (f). The cell number of 54 independent local sites (1 × 1 mm2) was counted. P-value < 0.0001 of linear regression by F-test; R, Pearson correlation coefficient. Source data is provided as a Source Data file. g Behavioral testing of the improvement in PTZ-induced seizure activity in zebrafish treated with Semaxinib. PTZ pentylenetetrazole. n = 24. Data are presented as mean ± SD. P-value by two-sided Mann-Whitney nonparametric test. Source data is provided as a Source Data file. h Schematic model of how vascular malformation contributes to seizure pathogenesis. In the lesion region, these FCs fail to encircle endothelial cells as normal SMCs do, depleting the SMC pool and impairing the contractility of vessels (including arteries and arterioles SMC). This leads to the creation of a local hypoxia environment within the lesion neocortex, which, along with mTOR activation, further disrupts astrocyte and neuron functions. AST astrocyte, aSMC arteries SMC, aaSMC arterioles SMC. PHENOTYPE:
|