
|
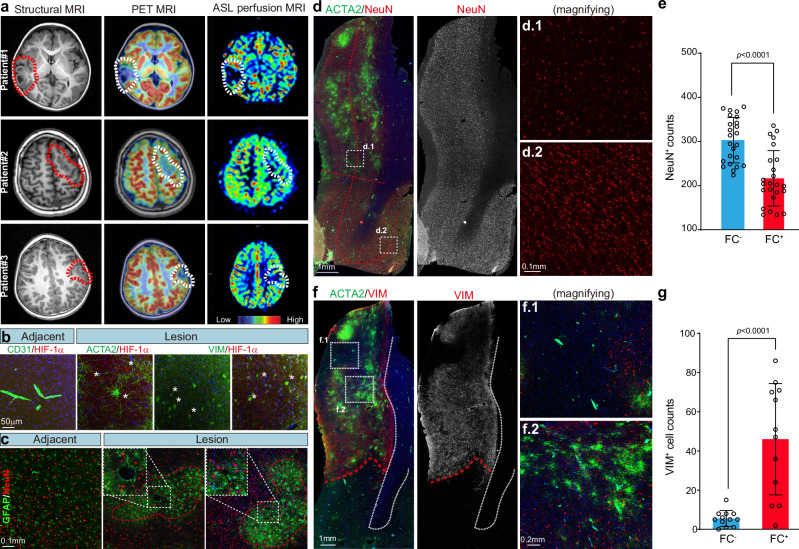
Fig. 4 Local ischemia-hypoxia: the pathogenic contribution of vascular malformation. a Imaging presentations showing the lesion sites in FCDIIb patients. MRI reveals focal cortical dysplasia, including cortical malformation, thickened neocortex, and blurred gray and white matter interface. PET/MRI images show focal hypometabolism in the lesion area. ASL perfusion MRI demonstrates a focal decrease in cerebral blood flow in the lesion area. b Immunofluorescence (IF) staining for CD31, ACTA2, VIM, and HIF-1α in the lesion and adjacent neocortex sections of FCDIIb patients. The asterisk indicates HIF-1α+ cells. Each experiment was repeated independently 3 times. c IF staining for GFAP (green) and NeuN (red) in neocortex sections of FCDIIb patients. GFAP-labeled astrocytes form a typical astrocytic island (red dashed circle). The dashed square indicates a local magnification. d IF staining for ACTA2 (green) and NeuN (red) for neocortex sections of FCDIIb patients. The dashed square indicates a local magnification. The red dashed curve indicates the boundary between the low and deep layers. e Statistical analysis of the impact of FCs presence on neuron count. The number of neurons in FC+ regions is significantly lower compared to FC− regions. FC−/+, FC negative/positive region. The neuron number of 24 independent local sites (1 × 1 mm2) was counted. Data are presented as mean ± SD. P-value < 0.0001 by two-sided Student’s t-test. Source data is provided as a Source Data file. FC, firework cell. f IF staining for ACTA2 (green) and VIM (red) in lesion neocortex sections of FCDIIb patients and associated statistics. The dashed square indicates a local magnification. The red dashed curve indicates the boundary between the lesion and adjacent areas. g Statistical analysis of the impact of FCs presence on VIM+ cell count. Regions with a higher number of FC+ cells show a significantly greater number of VIM+ cells compared to regions with fewer FC+ cells. The neuron number of 12 independent local sites (2 × 2 mm2) was counted. Data are presented as mean ± SD. P-value < 0.0001 by two-sided Mann-Whitney nonparametric test. Source data is provided as a Source Data file. FC firework cell.