
|
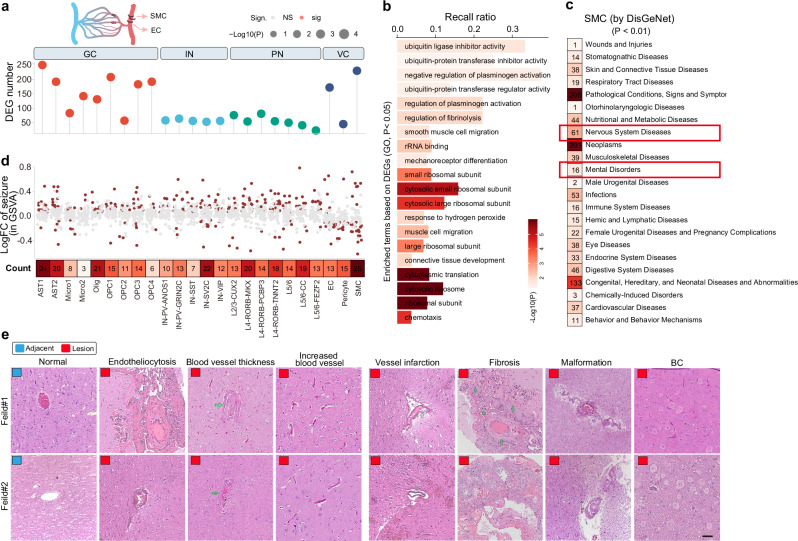
Fig. 2 Vasculature aberration is a dominant feature of the neocortex of the FCDIIb lesions. a Differentially expressed genes (DEGs) in each cluster when comparing lesion and adjacent neocortex. DEGs were identified by differential state analysis, with a cutoff of |log2 fold change | >1.5 and P-value < 0.05. P-value was defined by the limma-voom-based method using the Muscat R package. IN interneuron, PN projection neuron, GC glial cell, VC vasculature cell. b Top 20 of DEG-based enriched gene ontology (GO) terms of SMCs. DEGs from (a) were used for enrichment analysis with a cutoff p-value < 0.05. P-value was defined by the Hypergeometric test using the Gprofiler2 R package. c Statistics of SMC-related human diseases. Significant terms were defined by pathway-based differential analysis based on the Empirical Bayes method using the Limma R package, with a cutoff of p-value < 0.01. The pathway enrichment score for DisGeNet gene sets was calculated using the GSVA algorithm. d Differentially expressed pathways (DEPs) in clusters from Fig. 1b using seizure/epilepsy-related gene sets. The GSVA algorithm was employed to transform the pseudo-bulk expression matrix into a pathway matrix. DEPs were identified using the Limma R package with a cutoff p-value < 0.05. The heatmap indicates the total number of DEPs. DEPs were defined by the Empirical Bayes method using the Limma R package. e Representative histological features of neocortexes as determined by HE staining. Each experiment was repeated independently 3 times. Normal/Lesion; adjacent/lesion neocortex of FCDIIb; arrows indicate typical features; scale bar, 50 μm.