
- Title
-
The small molecule ML233 is a direct inhibitor of tyrosinase function
- Authors
- Menard, R., Baanannou, A., Halluin, C., Morse, D., Kuhn, S., Graber, J.H., Strickland, J., Madelaine, R.
- Source
- Full text @ Commun Biol
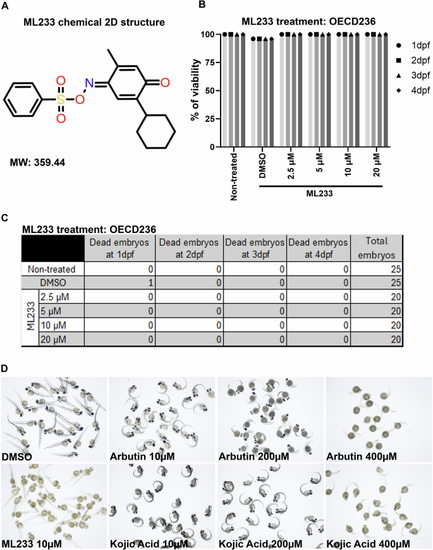
A 2D representative structure of the ML233 chemical (molecular weight: 359.44). B Zebrafish embryo survival (% of viability) was quantified in non-treated, control (DMSO) and ML233-treated embryos by OECD236 test to assess acute toxicity in fish embryos (n ≥ 20). C Table showing the number of embryos used for the OECD236 test in (B) and the survival rate every day between 1 and 4 dpf. D Skin pigmentation of DMSO-, ML233-, arbutin-, or -kojic acid-treated embryos at 48 hpf after treatment between 4 and 48 hpf. |
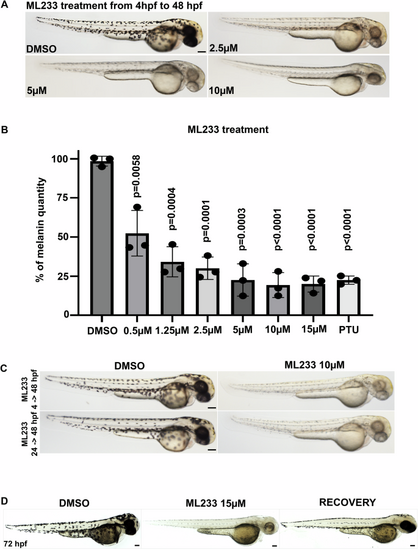
A Skin pigmentation of DMSO- or ML233-treated embryos at 48 hpf after treatment between 4 and 48 hpf. B Melanin was quantified in control or ML233-treated embryos (n = 3 biological replicates with 3 technical replicates; ≥40 embryos/biological replicate). Significance is determined by t-test, two-tailed, unpaired. C Skin pigmentation of DMSO- or ML233-treated embryos at 48 hpf after treatment between 4 and 48 hpf (top) or 24 and 48 hpf (bottom). D Skin pigmentation of DMSO, ML233-treated embryos (treatment between 24 and 72 hpf) and ML233-treated embryos after recovery (treatment between 24 and 48 hpf) at 72 hpf. Scale bars: 100 μm. Error bars represent s.d. |

A Tyrosinase activity was quantified in cellular extracts of DMSO- or ML233-treated embryos for 24 h (n = 3 biological replicates with 3 technical replicates; ≥40 embryos/biological replicate). Significance is determined by t-test, two-tailed, unpaired. Error bars represent s.d. B−D Kinetic assays of L-DOPA conversion by Tyrosinase in presence or absence of ML233 at 5 µM or 20 µM over a 15 min time course analysis (B). Tyrosinase activity was quantified in vitro in DMSO- or ML233-treated samples (n = 4). Significance is determined by t-test, two-tailed, unpaired. Error bars represent s.d. C Lineweaver-Burk plot indicates that after 1 min, ML233 acts with a competitive inhibition mode on the Tyrosinase protein (D). E, F Two-state reaction model SPR analysis to determine the binding affinity of L-DOPA (C) and ML233 (D) with human TYR. Two-fold dilution series of 5 doses with a high concentration of 500 µM for L-DOPA and 50 µM for ML233 were used. G Table showing the constants of association and dissociation calculated for L-DOPA and ML233 interaction with human TYR. Significance is determined by t-test, two-tailed, unpaired. Error bars represent s.d. |
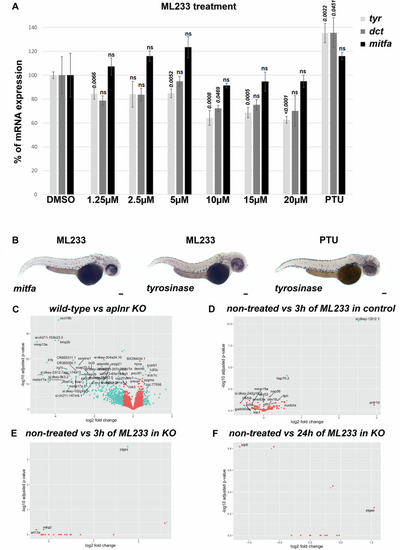
A Analysis of tyr, dct, and mitfa mRNA expression by RT-qPCR in DMSO-, ML233-, or PTU-treated (between 24 and 48 hpf) zebrafish embryos at 48 hpf (n = 3 biological replicates with 3 technical replicates; ≥40 embryos/biological replicate). Significance is determined by t-test, two-tailed, unpaired. B Analysis of mitfa and tyr mRNA expression by in situ hybridization in ML233- or PTU-treated (between 24 and 48 hpf) embryos at 48 hpf. Graphical representation of bulk RNAseq analysis (n = 4; ≥20 embryos/sample) and variation in gene-expression profiles in WT vs. apelin-receptor KO, both untreated (C), WT after 3 h of ML233 treatment (D); apelin-receptor KO after 3 h of ML233 treatment (E); and apelin-receptor KO after 24 h of ML233 treatment (F). Scale bars: 100 μm. Error bars represent s.d. |
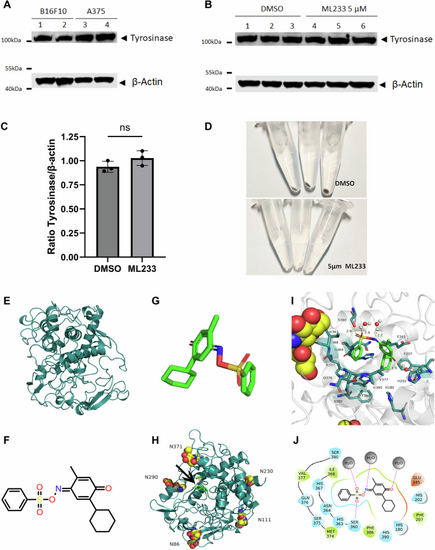
A Expression of tyrosinase protein was analyzed by western blot in murine (B16F10) or human (A375) melanoma cells (n = 3). B Expression of tyrosinase protein was analyzed by western blot in murine (B16F10) melanoma cells after DMSO or ML233 treatment (n = 3). C Tyrosinase protein expression was quantified and normalized by expression of the beta-actin protein after DMSO or ML233 treatment. Significance is determined by t-test, two-tailed, unpaired. Error bars represent s.d. D Representative pictures of melanin expression in murine (B16F10) melanoma cells after DMSO or ML233 treatment. E 3D structure of human TYR protein. F 2D representative structure of the ML233 chemical. G 3D representative structure of the ML233 chemical. H 3D structure of human TYR protein with asparagine N-glycosylation sites and ML233 binding site (black arrow). I 3D representation of TYR and ML233 interaction. J 2D representation of TYR and ML233 interaction. Hydrogen bonds are represented by purple arrows, and amino-acid colors indicate different properties: green for hydrophobic amino acids, cyan for polar amino acids, and red for acidic negatively charged amino acids. Water molecules are represented by gray spheres. |
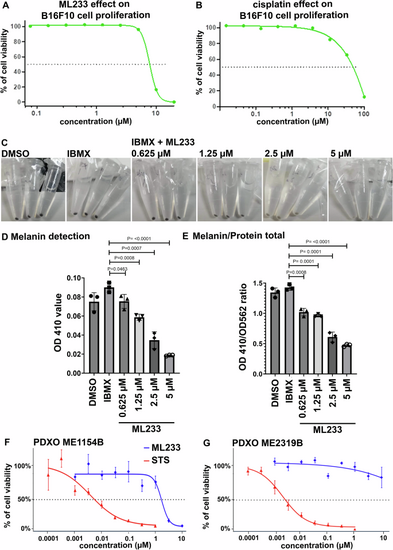
Effect of ML233 (A) or cisplatin (B, positive control) treatment on B16F10 murine melanoma cell proliferation (n = 3). C Representative pictures of melanin expression in murine (B16F10) melanoma cells after treatment with DMSO, IBMX alone, or IBMX plus ML233. Melanin expression was quantified (D) and normalized (E) after treatment with DMSO, IBMX alone, or IBMX plus ML233 (n = 3). Significance is determined by t-test, two-tailed, unpaired. Cell proliferation in PDXO cellular models was quantified in ME1154B (F) or ME2319B (G) human melanoma lines after staurosporine (STS, positive control) or ML233 treatment (n = 3). Error bars represent s.d. |