
|
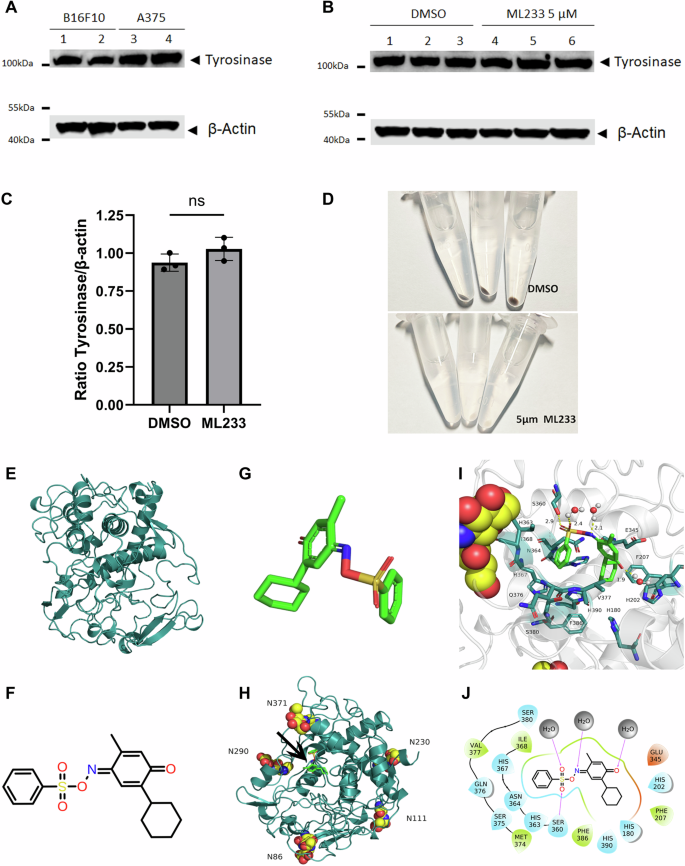
Fig. 5 A Expression of tyrosinase protein was analyzed by western blot in murine (B16F10) or human (A375) melanoma cells (n = 3). B Expression of tyrosinase protein was analyzed by western blot in murine (B16F10) melanoma cells after DMSO or ML233 treatment (n = 3). C Tyrosinase protein expression was quantified and normalized by expression of the beta-actin protein after DMSO or ML233 treatment. Significance is determined by t-test, two-tailed, unpaired. Error bars represent s.d. D Representative pictures of melanin expression in murine (B16F10) melanoma cells after DMSO or ML233 treatment. E 3D structure of human TYR protein. F 2D representative structure of the ML233 chemical. G 3D representative structure of the ML233 chemical. H 3D structure of human TYR protein with asparagine N-glycosylation sites and ML233 binding site (black arrow). I 3D representation of TYR and ML233 interaction. J 2D representation of TYR and ML233 interaction. Hydrogen bonds are represented by purple arrows, and amino-acid colors indicate different properties: green for hydrophobic amino acids, cyan for polar amino acids, and red for acidic negatively charged amino acids. Water molecules are represented by gray spheres.