
|
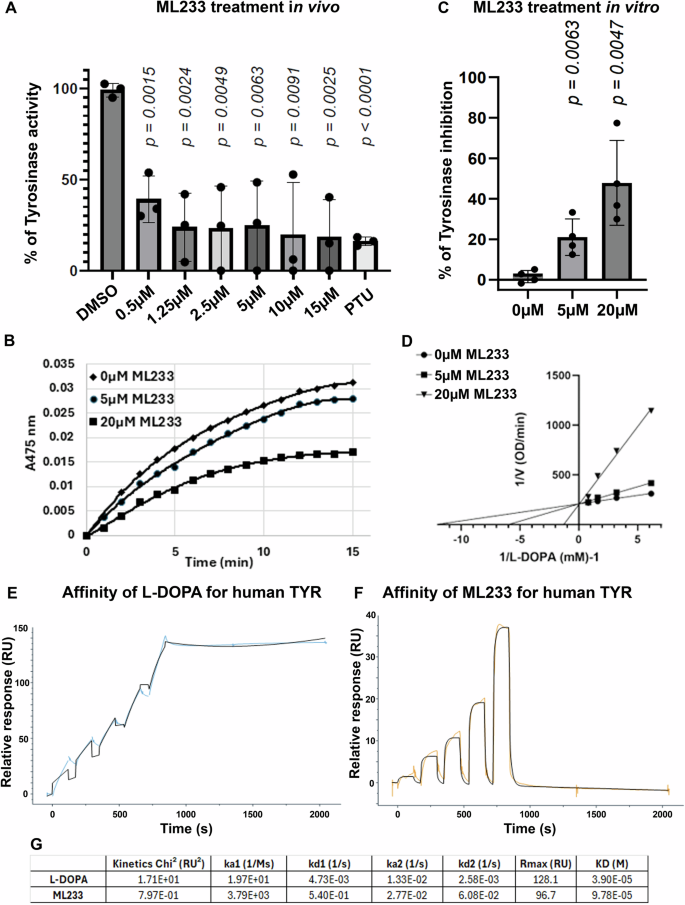
Fig. 3 A Tyrosinase activity was quantified in cellular extracts of DMSO- or ML233-treated embryos for 24 h (n = 3 biological replicates with 3 technical replicates; ≥40 embryos/biological replicate). Significance is determined by t-test, two-tailed, unpaired. Error bars represent s.d. B−D Kinetic assays of L-DOPA conversion by Tyrosinase in presence or absence of ML233 at 5 µM or 20 µM over a 15 min time course analysis (B). Tyrosinase activity was quantified in vitro in DMSO- or ML233-treated samples (n = 4). Significance is determined by t-test, two-tailed, unpaired. Error bars represent s.d. C Lineweaver-Burk plot indicates that after 1 min, ML233 acts with a competitive inhibition mode on the Tyrosinase protein (D). E, F Two-state reaction model SPR analysis to determine the binding affinity of L-DOPA (C) and ML233 (D) with human TYR. Two-fold dilution series of 5 doses with a high concentration of 500 µM for L-DOPA and 50 µM for ML233 were used. G Table showing the constants of association and dissociation calculated for L-DOPA and ML233 interaction with human TYR. Significance is determined by t-test, two-tailed, unpaired. Error bars represent s.d.