
|
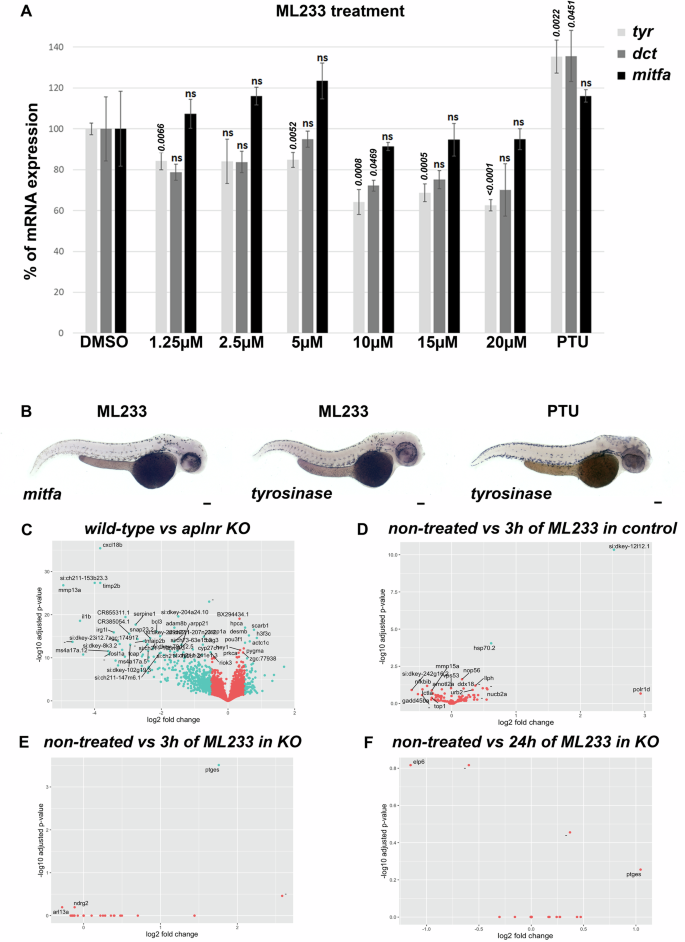
Fig. 4 A Analysis of tyr, dct, and mitfa mRNA expression by RT-qPCR in DMSO-, ML233-, or PTU-treated (between 24 and 48 hpf) zebrafish embryos at 48 hpf (n = 3 biological replicates with 3 technical replicates; ≥40 embryos/biological replicate). Significance is determined by t-test, two-tailed, unpaired. B Analysis of mitfa and tyr mRNA expression by in situ hybridization in ML233- or PTU-treated (between 24 and 48 hpf) embryos at 48 hpf. Graphical representation of bulk RNAseq analysis (n = 4; ≥20 embryos/sample) and variation in gene-expression profiles in WT vs. apelin-receptor KO, both untreated (C), WT after 3 h of ML233 treatment (D); apelin-receptor KO after 3 h of ML233 treatment (E); and apelin-receptor KO after 24 h of ML233 treatment (F). Scale bars: 100 μm. Error bars represent s.d.