
- Title
-
Chemokine induces phase transition from non-directional to directional migration during angiogenesis
- Authors
- Gui, N., Sako, K., Fukumoto, M., Mochizuki, N., Nakajima, H.
- Source
- Full text @ Cell Struct Funct
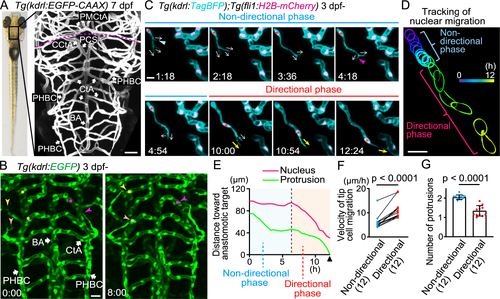
Sprouting tip cells undergo two phases, non-directional and directional phases, to reach the target vessels (A) Representative confocal image of the brain of a Tg(kdrl:EGFP-CAAX) larva (7 dpf). Plasma membrane of endothelial cells (ECs) is labeled with EGFP-CAAX. Dorsal view, anterior to the top. The dotted line indicates the boundary between the hindbrain (posterior) and midbrain (anterior). (B) Time-sequential images of a Tg(kdrl:EGFP) larva (from 3 dpf). Elapsed time (h:min). kdrl:EGFP+ ECs are shown as green. ECs sprouting (arrowheads) from the primordial hindbrain channel (PHBC) eventually connect to the central artery (CtA) (circles). (C) Time-sequential images of a Tg(kdrl:TagBFP);Tg(fli1:H2B-mCherry) larva (from 3 dpf). kdrl:TagBFP+ ECs and fli1:H2B-mCherry+ EC nuclei are shown as cyan and magenta, respectively. Direction of protrusions is indicated by arrows. In the non-directional phase, tip cells sprouting from the PHBC dynamically retract (blue arrowhead) and extend (magenta arrowhead) their protrusions in various directions (arrows). Then, the nuclei of tip cells (asterisks) rapidly move toward the anastomotic targets, the CtAs, in the directional phase. (D) Tracking of the nucleus of the tip cell shown in (C). The outline of the nucleus is depicted every 0.5 h as different colors. (E) Quantitative analysis of the data shown in (C). Minimum distance between the anastomotic target and the tip cell nucleus (magenta) or the distal edge of the protrusion (green) at each time point until the connection to the target vessel (arrowhead). (F) Graph shows the time-averaged velocity of the tip cell nucleus in the non-directional and directional phases. Data are mean � s.d. (n = 12 cells from 6 larvae). (G) Graph shows the time-averaged number of protrusions per tip cell throughout the non-directional and directional phases. Data are mean � s.d. (n = 12 cells from 6 larvae). Scale bar: 10 ?m. P values were determined by paired (F) or unpaired (G) two-tailed Student?s t-test. BA, basilar artery; PHBC, primordial hindbrain channel; CtA, central artery; CCtA, cerebellar central artery; PCS, posterior communicating segment; PMCtA, posterior metencephalic central artery. |
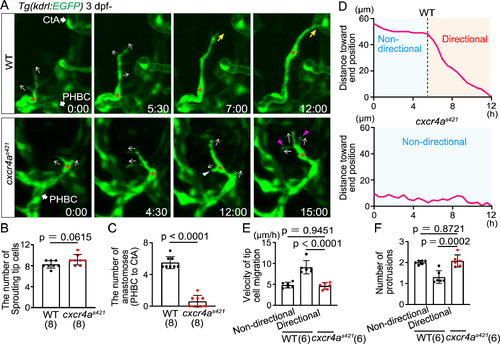
Cxcr4a is important for directional migration to anastomotic targets (A) Time-sequential images of Tg(kdrl:EGFP) WT and cxcr4as421 sibling larvae (from 3 dpf). Asterisks indicate tip cell nuclei. In cxcr4as421 larvae, tip cells sprouting from the PHBC repeatedly extend (magenta arrowheads) and retract (blue arrowhead) their protrusions in various directions (arrows). They do not migrate toward the target vessel. (B) Graph shows the number of tip cells sprouting from the PHBC in WT and cxcr4as421 sibling larvae (from 73 hpf to 121 hpf). Data are mean � s.d. (WT, n = 8 larvae; cxcr4as421, n = 8 larvae). Each dot represents an individual larva in this graph. (C) Graph shows the number of connections of tip cells sprouting from the PHBC to the CtAs or CCtAs in WT and cxcr4as421 sibling larvae (from 73 hpf to 121 hpf). Data are mean � s.d. (WT, n = 8 larvae; cxcr4as421, n = 8 larvae). (D) Quantitative analysis of the data shown in (A). Minimum distance between the position of the tip cell nucleus at each time point and the position of the nucleus at 12 h in WT and cxcr4as421 sibling larvae. Connection to the target CtA occurs around 12 h in this WT larva as shown in (A). (E) Graph shows the time-averaged velocity of the tip cell nucleus in WT (non-directional and directional phases) and cxcr4as421 sibling larvae. Data are mean � s.d. (WT, n = 6 cells in 4 larvae; cxcr4as421, n = 6 cells in 4 larvae). (F) Graph shows the time-averaged number of protrusions per tip cell in WT (non-directional and directional phases) and cxcr4as421 sibling larvae. Data are mean � s.d. (WT, n = 6 cells in 4 larvae; cxcr4as421, n = 6 cells in 4 larvae). Scale bar: 10 ?m. P values were determined by two-tailed Student?s t-test (B, C) and one-way ANOVA with Tukey?s test (E, F). |
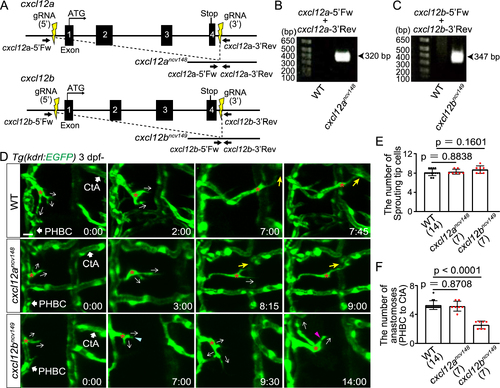
Cxcl12b but not Cxcl12a is responsible for directional migration to anastomotic targets (A) Schematic representation for generating full locus deletion alleles in cxcl12a and cxcl12b. Double guide RNAs (gRNAs) (yellow) were designed upstream of the 5' UTR and downstream of the 3' UTR, flanking all exons. (B,C) Images of gels showing full locus deletions in cxcr12ancv148 (B) and cxcr12bncv149 homozygous mutants (C). Primer sites are shown in (A). (D) Time-sequential images of Tg(kdrl:EGFP) WT, cxcr12ancv148, and cxcr12bncv149 larvae (from 3 dpf). Asterisks indicate tip cell nuclei. In WT and cxcr12ancv148 larvae, tip cells sprouting from the PHBC finally undergo directional migration to the target CtAs (yellow arrows). In contrast, in cxcr12bncv149 larvae, tip cells sprouting from the PHBC repeatedly extend (magenta arrowhead) and retract (blue arrowhead) their protrusions while extending them in various directions (arrows), and do not migrate toward the target. (E) Graph shows the number of tip cells sprouting from the PHBC in WT, cxcr12ancv148, and cxcr12bncv149 larvae (from 73 hpf to 121 hpf). Data are mean � s.d. (WT, n = 14 larvae; cxcr12ancv148, n = 7 larvae; cxcr12bncv149 , n = 7 larvae). (F) Graph shows the number of connections of tip cells sprouting from the PHBC to the CtAs or CCtAs in WT, cxcr12ancv148, and cxcr12bncv149 larvae (from 73 hpf to 121 hpf). Data are mean � s.d. (WT, n = 14 larvae; cxcr12ancv148, n = 7 larvae; cxcr12bncv149 , n = 7 larvae). Scale bar: 10 ?m. P values were determined by one-way ANOVA with Tukey?s test. |
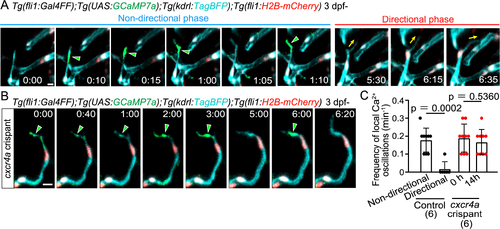
Local Ca2+ oscillations occur specifically in the non-directional phase (A) Time-sequential images of a Tg(fli1:Gal4FF);Tg(UAS:GCaMP7a);Tg(kdrl:TagBFP);Tg(fli1:H2B-mC) larva (3 dpf) after tip cell sprouting from the PHBC. Elapsed time (h:min). Local Ca2+ signals (green arrowheads) are detected in the leading front of tip cells in the non-directional phase, but rarely in the directional phase. (B) Time-sequential images of a Tg(fli1:Gal4FF);Tg(UAS:GCaMP7a);Tg(kdrl:TagBFP);Tg(fli1:H2B-mC) cxcr4a crispant larva (F0 injected larva) (3 dpf) after tip cell sprouting from the PHBC. Local Ca2+ signals are maintained in the leading front of tip cells (green arrowheads) that do not head to the target vessels. (C) Graph shows the frequency of local Ca2+ oscillations in the leading front of tip cells in control and cxcr4a crispants (3?4 dpf). Data are mean � s.d. (WT: n = 9 cells in the non-directional phase, n = 6 cells in the directional phase in 6 larvae; cxcr4as421: n = 9 cells (at 0 h), 9 cells (at 14 h) in 6 larvae). Scale bar: 10 ?m. P value was determined by unpaired two-tailed Student?s t-test. |
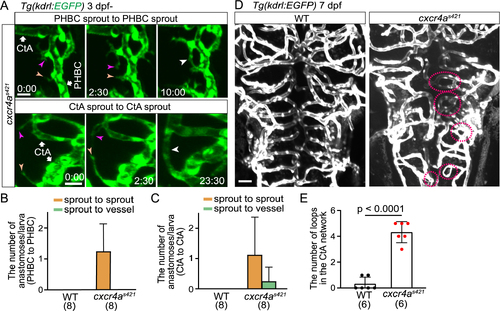
Cerebral capillary network patterning becomes altered in cxcr4as421 mutants (A) Time-sequential images of Tg(kdrl:EGFP) cxcr4as421 mutant larva (from 3 dpf). Upper: a tip cell sprout from the PHBC (magenta arrowheads) connects with another tip cell sprout from the PHBC nearby (orange arrowheads). Lower: a tip cell ectopically sprouts from the CtA (magenta arrowheads) and is often connected with another tip cell sprouting from the nearby CtA (orange arrowheads). (B) Graph shows the number of tip cell sprouts from the PHBC anastomosing with other sprouts from the PHBC (sprout to sprout, orange bar) and the number of tip cell sprouts from the PHBC anastomosing with the PHBC vessel (sprout to vessel, green bar) in WT and cxcr4as421 sibling larvae (from 73 hpf to 121 hpf). Data are mean � s.d. (WT, n = 8 larvae; cxcr4as421, n = 8 larvae). (C) Graph shows the number of CtA sprouts anastomosing with other CtA sprouts (sprout to sprout, orange bar) or with CtA vessels (sprout to vessel, green bar) in WT and cxcr4as421 sibling larvae (from 73 hpf to 121 hpf). Data are mean � s.d. (WT, n = 8 larvae; cxcr4as421, n = 8 larvae). (D) Tg(kdrl:EGFP) WT and cxcr4as421 sibling larvae (7 dpf). Small vessel loops (dotted circles) are increased in cxcr4as421 mutants. (E) Quantitative analysis of the data shown in (D). The number of loops (less than 20 ?m) in the CtA capillary network in the hindbrain of WT and cxcr4as421 sibling larvae. Data are mean � s.d. (WT, n = 6 larvae; cxcr4as421, n = 6 larvae). Scale bar: 10 ?m. P value was determined by unpaired two-tailed Student?s t-test. |