
|
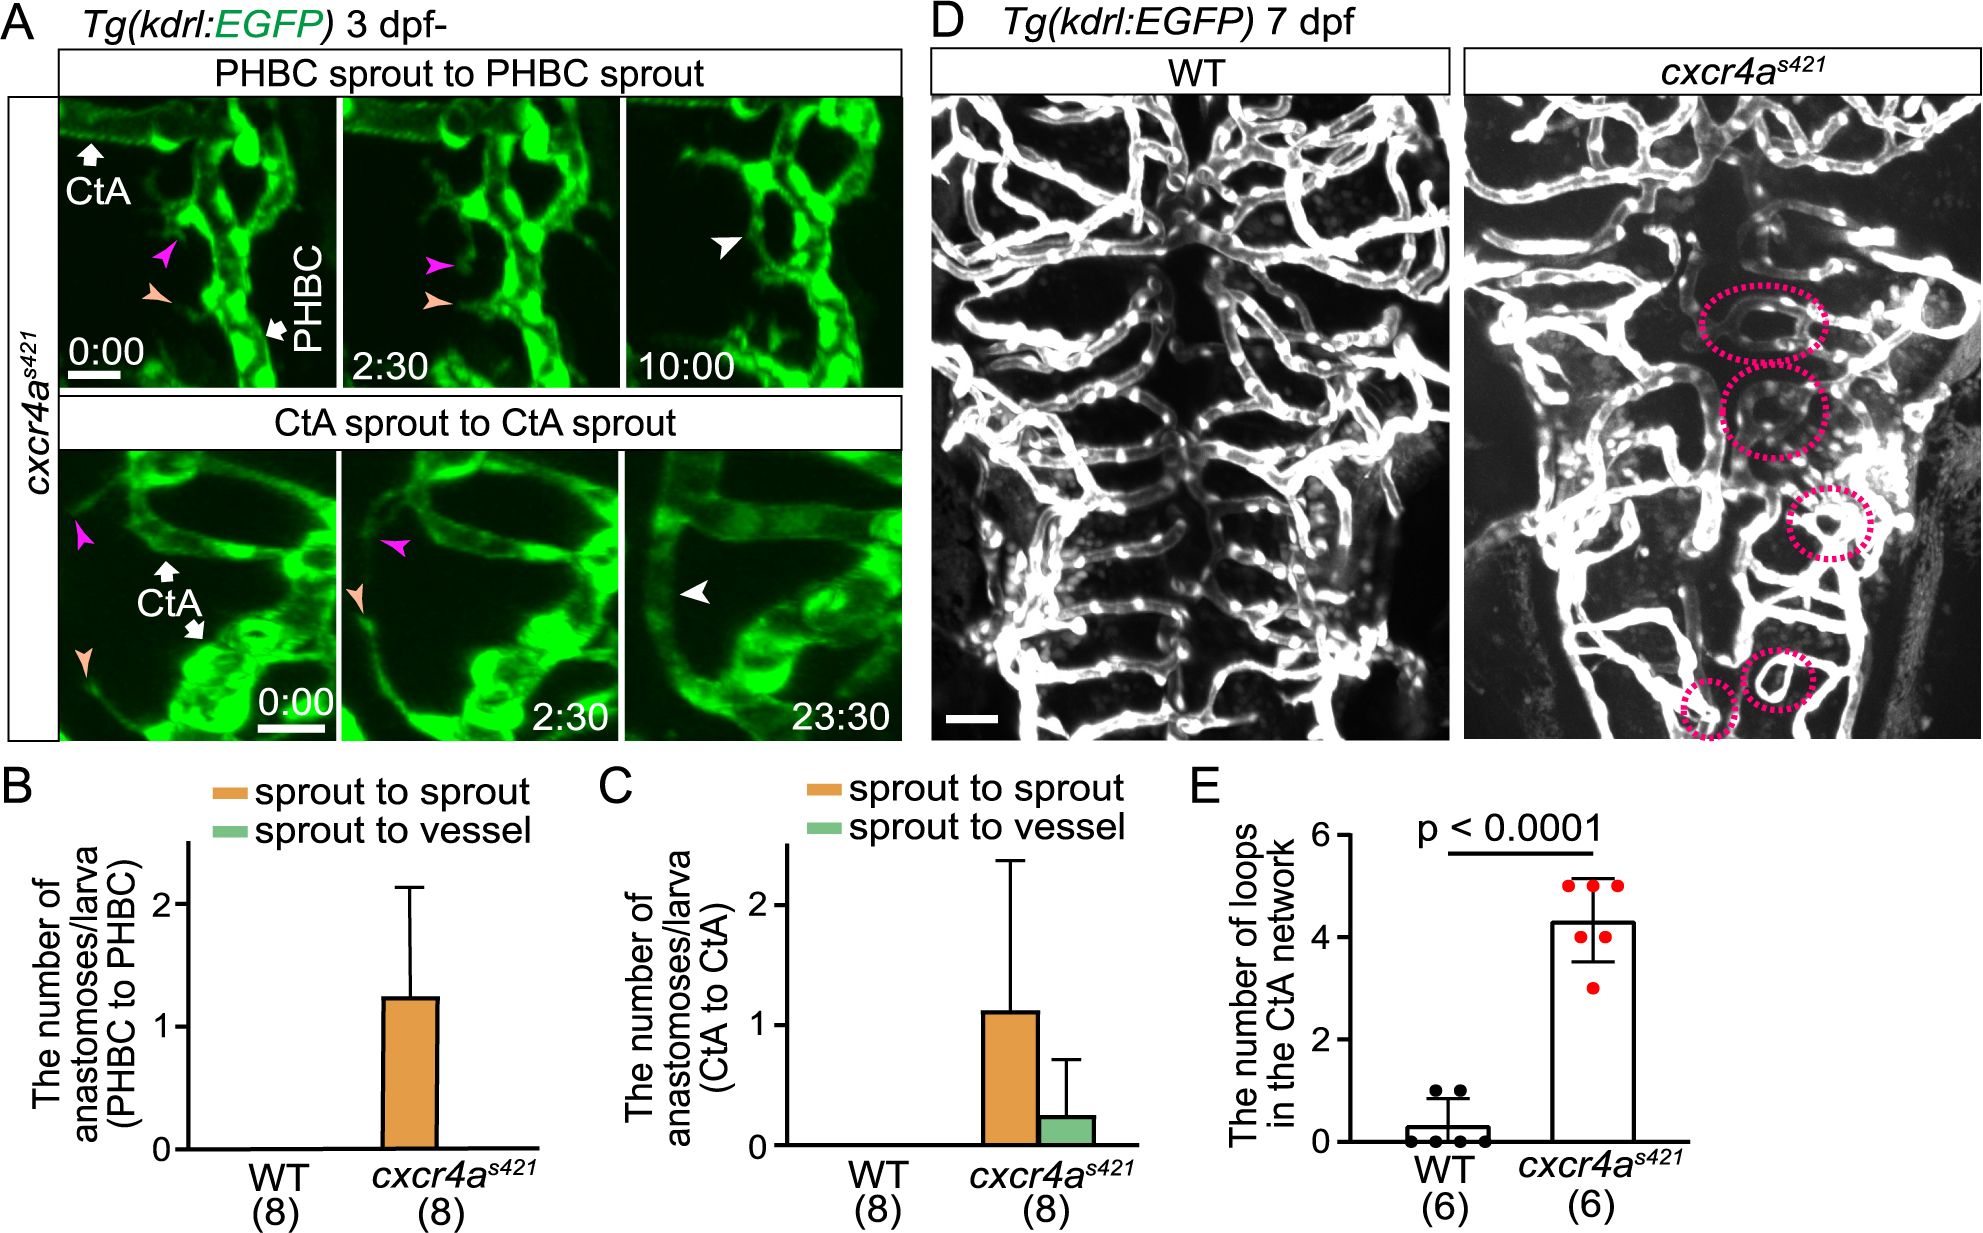
Fig. 5 Cerebral capillary network patterning becomes altered in cxcr4as421 mutants (A) Time-sequential images of Tg(kdrl:EGFP) cxcr4as421 mutant larva (from 3 dpf). Upper: a tip cell sprout from the PHBC (magenta arrowheads) connects with another tip cell sprout from the PHBC nearby (orange arrowheads). Lower: a tip cell ectopically sprouts from the CtA (magenta arrowheads) and is often connected with another tip cell sprouting from the nearby CtA (orange arrowheads). (B) Graph shows the number of tip cell sprouts from the PHBC anastomosing with other sprouts from the PHBC (sprout to sprout, orange bar) and the number of tip cell sprouts from the PHBC anastomosing with the PHBC vessel (sprout to vessel, green bar) in WT and cxcr4as421 sibling larvae (from 73 hpf to 121 hpf). Data are mean ± s.d. (WT, n = 8 larvae; cxcr4as421, n = 8 larvae). (C) Graph shows the number of CtA sprouts anastomosing with other CtA sprouts (sprout to sprout, orange bar) or with CtA vessels (sprout to vessel, green bar) in WT and cxcr4as421 sibling larvae (from 73 hpf to 121 hpf). Data are mean ± s.d. (WT, n = 8 larvae; cxcr4as421, n = 8 larvae). (D) Tg(kdrl:EGFP) WT and cxcr4as421 sibling larvae (7 dpf). Small vessel loops (dotted circles) are increased in cxcr4as421 mutants. (E) Quantitative analysis of the data shown in (D). The number of loops (less than 20 μm) in the CtA capillary network in the hindbrain of WT and cxcr4as421 sibling larvae. Data are mean ± s.d. (WT, n = 6 larvae; cxcr4as421, n = 6 larvae). Scale bar: 10 μm. P value was determined by unpaired two-tailed Studentʼs t-test.