
|
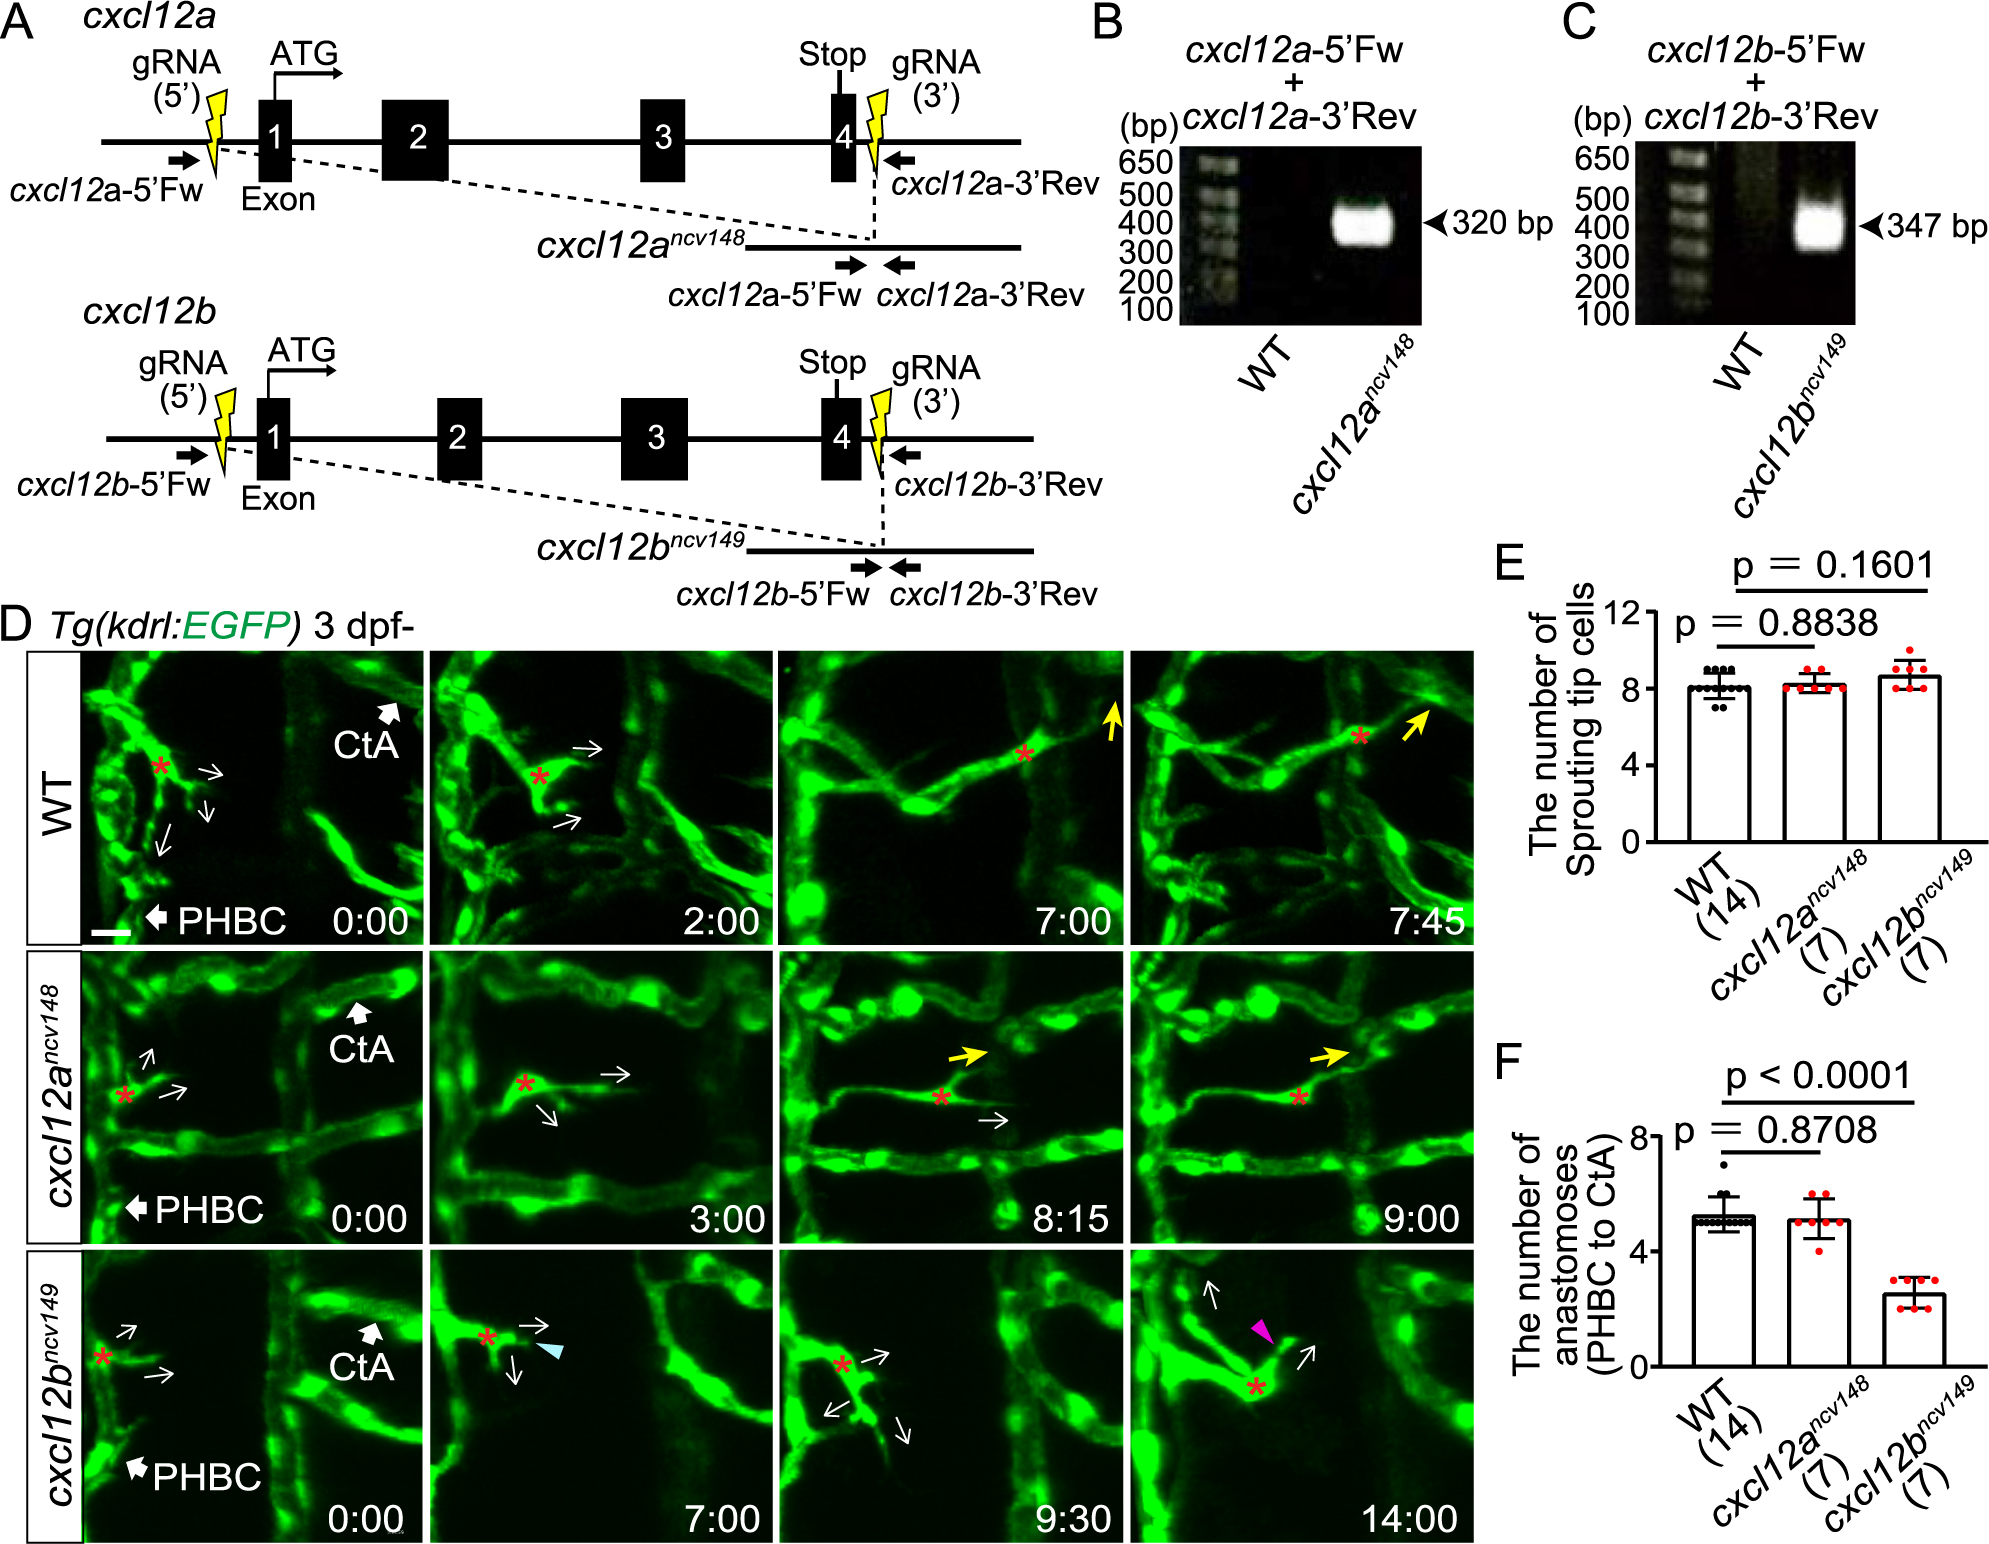
Fig. 3 Cxcl12b but not Cxcl12a is responsible for directional migration to anastomotic targets (A) Schematic representation for generating full locus deletion alleles in cxcl12a and cxcl12b. Double guide RNAs (gRNAs) (yellow) were designed upstream of the 5' UTR and downstream of the 3' UTR, flanking all exons. (B,C) Images of gels showing full locus deletions in cxcr12ancv148 (B) and cxcr12bncv149 homozygous mutants (C). Primer sites are shown in (A). (D) Time-sequential images of Tg(kdrl:EGFP) WT, cxcr12ancv148, and cxcr12bncv149 larvae (from 3 dpf). Asterisks indicate tip cell nuclei. In WT and cxcr12ancv148 larvae, tip cells sprouting from the PHBC finally undergo directional migration to the target CtAs (yellow arrows). In contrast, in cxcr12bncv149 larvae, tip cells sprouting from the PHBC repeatedly extend (magenta arrowhead) and retract (blue arrowhead) their protrusions while extending them in various directions (arrows), and do not migrate toward the target. (E) Graph shows the number of tip cells sprouting from the PHBC in WT, cxcr12ancv148, and cxcr12bncv149 larvae (from 73 hpf to 121 hpf). Data are mean ± s.d. (WT, n = 14 larvae; cxcr12ancv148, n = 7 larvae; cxcr12bncv149 , n = 7 larvae). (F) Graph shows the number of connections of tip cells sprouting from the PHBC to the CtAs or CCtAs in WT, cxcr12ancv148, and cxcr12bncv149 larvae (from 73 hpf to 121 hpf). Data are mean ± s.d. (WT, n = 14 larvae; cxcr12ancv148, n = 7 larvae; cxcr12bncv149 , n = 7 larvae). Scale bar: 10 μm. P values were determined by one-way ANOVA with Tukey’s test.