
Fig. 1
- ID
- ZDB-FIG-250512-1
- Publication
- Gui et al., 2025 - Chemokine induces phase transition from non-directional to directional migration during angiogenesis
- Other Figures
- All Figure Page
- Back to All Figure Page
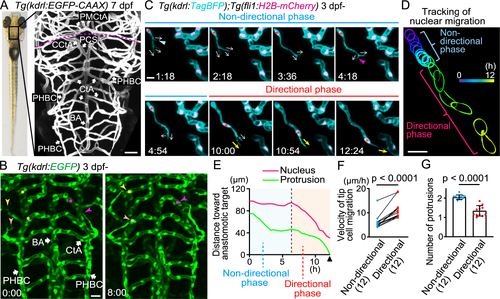
Sprouting tip cells undergo two phases, non-directional and directional phases, to reach the target vessels (A) Representative confocal image of the brain of a Tg(kdrl:EGFP-CAAX) larva (7 dpf). Plasma membrane of endothelial cells (ECs) is labeled with EGFP-CAAX. Dorsal view, anterior to the top. The dotted line indicates the boundary between the hindbrain (posterior) and midbrain (anterior). (B) Time-sequential images of a Tg(kdrl:EGFP) larva (from 3 dpf). Elapsed time (h:min). kdrl:EGFP+ ECs are shown as green. ECs sprouting (arrowheads) from the primordial hindbrain channel (PHBC) eventually connect to the central artery (CtA) (circles). (C) Time-sequential images of a Tg(kdrl:TagBFP);Tg(fli1:H2B-mCherry) larva (from 3 dpf). kdrl:TagBFP+ ECs and fli1:H2B-mCherry+ EC nuclei are shown as cyan and magenta, respectively. Direction of protrusions is indicated by arrows. In the non-directional phase, tip cells sprouting from the PHBC dynamically retract (blue arrowhead) and extend (magenta arrowhead) their protrusions in various directions (arrows). Then, the nuclei of tip cells (asterisks) rapidly move toward the anastomotic targets, the CtAs, in the directional phase. (D) Tracking of the nucleus of the tip cell shown in (C). The outline of the nucleus is depicted every 0.5 h as different colors. (E) Quantitative analysis of the data shown in (C). Minimum distance between the anastomotic target and the tip cell nucleus (magenta) or the distal edge of the protrusion (green) at each time point until the connection to the target vessel (arrowhead). (F) Graph shows the time-averaged velocity of the tip cell nucleus in the non-directional and directional phases. Data are mean ± s.d. (n = 12 cells from 6 larvae). (G) Graph shows the time-averaged number of protrusions per tip cell throughout the non-directional and directional phases. Data are mean ± s.d. (n = 12 cells from 6 larvae). Scale bar: 10 μm. P values were determined by paired (F) or unpaired (G) two-tailed Studentʼs t-test. BA, basilar artery; PHBC, primordial hindbrain channel; CtA, central artery; CCtA, cerebellar central artery; PCS, posterior communicating segment; PMCtA, posterior metencephalic central artery. |