
Fig. 4
- ID
- ZDB-FIG-250512-4
- Publication
- Gui et al., 2025 - Chemokine induces phase transition from non-directional to directional migration during angiogenesis
- Other Figures
- All Figure Page
- Back to All Figure Page
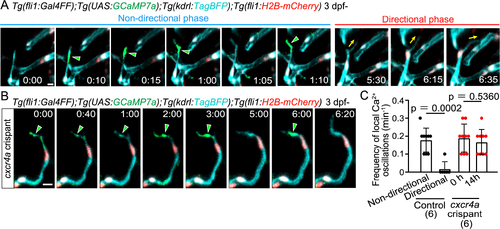
Local Ca2+ oscillations occur specifically in the non-directional phase (A) Time-sequential images of a Tg(fli1:Gal4FF);Tg(UAS:GCaMP7a);Tg(kdrl:TagBFP);Tg(fli1:H2B-mC) larva (3 dpf) after tip cell sprouting from the PHBC. Elapsed time (h:min). Local Ca2+ signals (green arrowheads) are detected in the leading front of tip cells in the non-directional phase, but rarely in the directional phase. (B) Time-sequential images of a Tg(fli1:Gal4FF);Tg(UAS:GCaMP7a);Tg(kdrl:TagBFP);Tg(fli1:H2B-mC) cxcr4a crispant larva (F0 injected larva) (3 dpf) after tip cell sprouting from the PHBC. Local Ca2+ signals are maintained in the leading front of tip cells (green arrowheads) that do not head to the target vessels. (C) Graph shows the frequency of local Ca2+ oscillations in the leading front of tip cells in control and cxcr4a crispants (3–4 dpf). Data are mean ± s.d. (WT: n = 9 cells in the non-directional phase, n = 6 cells in the directional phase in 6 larvae; cxcr4as421: n = 9 cells (at 0 h), 9 cells (at 14 h) in 6 larvae). Scale bar: 10 μm. P value was determined by unpaired two-tailed Studentʼs t-test. |