
- Title
-
Phenylthiourea synergistically enhances the hepatotoxicity of bavachalcone by interfering with metabolism in zebrafish: A factor to consider when evaluating toxicity of environmental pollutants using zebrafish models
- Authors
- Zheng, T., Zhao, J., Sun, C., Zhu, C., Li, C., Zhou, J., Yang, J., Zhang, Y.
- Source
- Full text @ Ecotoxicol. Environ. Saf.
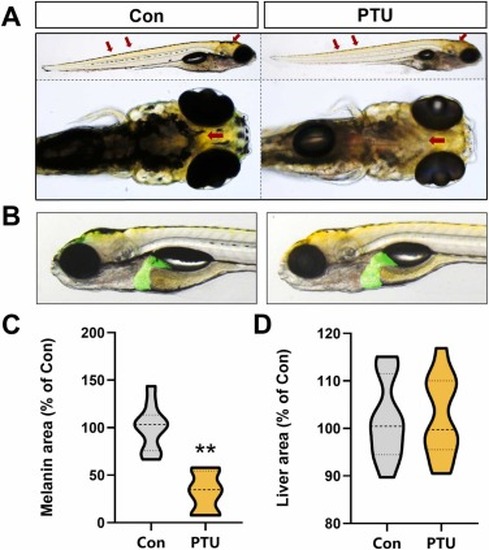
Effect of 200 μM PTU on zebrafish: (A): Zebrafish melanogenesis; red arrows indicate melanin. (B): Zebrafish liver morphology; green fluorescence indicates the liver. (C): Zebrafish head melanin area statistics (n = 15). (D): Zebrafish liver area statistics (n = 15). * *p < 0.01 vs. Con. |
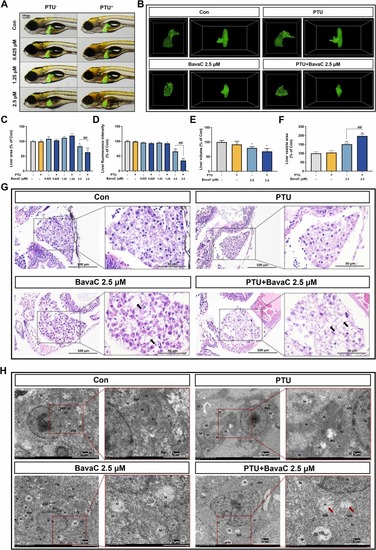
Effect of PTU combined with BavaC on the morphology, pathological structure and ultrastructure of zebrafish livers: (A): Zebrafish liver, 2D morphology. (B): Zebrafish liver, 3D morphology. (C): Zebrafish liver area statistics (n = 15). (D): Zebrafish liver fluorescence intensity statistics (n = 15). (E): Zebrafish liver volume statistics (n = 15). (F): Zebrafish liver vesicle area statistics (n = 5). (G): HE-stained pathological tissue sections; black arrows indicate vacuoles. (H): Ultrastructural electron microscopy images of the nucleus (N), mitochondria (M), rough endoplasmic reticulum (RER), lysosome (Ly) and autolysosome (ASS); red arrows indicate diseased mitochondria. *p < 0.05 vs. Con, * *p < 0.01 vs. Con, ##p < 0.01 vs. BavaC 2.5 μM. |
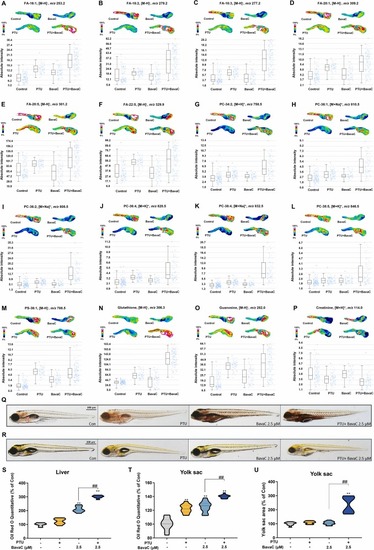
Effect of PTU combined with BavaC on endogenous metabolites and oil red O staining in zebrafish: (A-P): MALDI-MS images and metabolite expression level statistics. (Q): Oil red O staining; the red line indicates the liver, and the white line indicates the yolk sac. (R): Bright field images of zebrafish; the white line indicates the yolk sac. (S): Quantitative statistics of the oil red O staining results for the liver (n = 10). (T): Quantitative statistics of the oil red O staining results for the yolk sac (n = 10). (U): Statistics of the yolk sac area (n = 15). * *p < 0.01 vs. Con, ##p < 0.01 vs. BavaC 2.5 μM. FA: fatty acids; PC: phosphatidylcholine; PS: phosphatidylserine. |
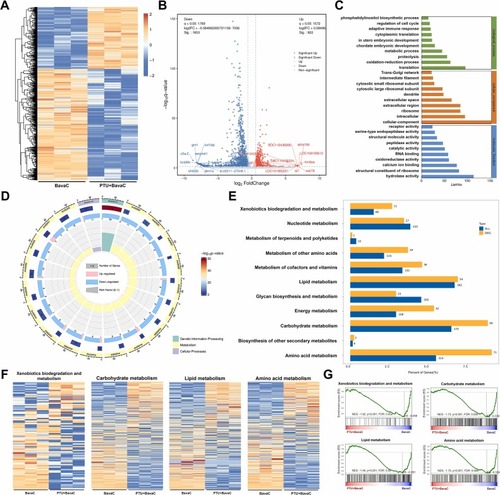
Effect of PTU combined with BavaC on gene expression profiles in zebrafish: (A): Cluster map of differentially expressed gene groups. (B): Volcano plot of differentially expressed genes. (C): GO enrichment analysis plot of differentially expressed genes. (D): Circle plot of the KEGG enrichment analysis. (E): KEGG enrichment bar chart for differentially expressed genes. (F): GSEA gene group cluster map. (G): GSEA enrichment map. |
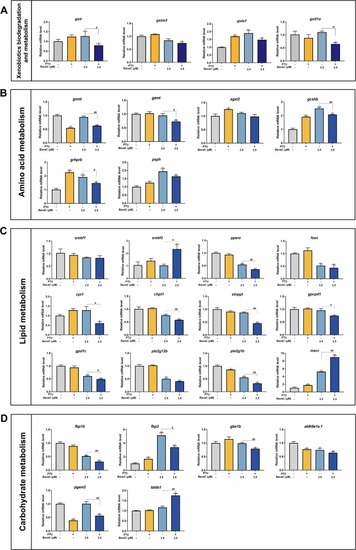
Effect of PTU combined with BavaC on metabolic pathway-related gene expression levels: (A): Xenobiotic biodegradation and metabolism-related gene expression levels. (B): Amino acid metabolism-related gene expression levels. (C): Lipid metabolism-related gene expression levels. (D): Carbohydrate metabolism-related gene expression levels. *p < 0.05 vs. Con, * *p < 0.01 vs. Con, #p < 0.05 vs. BavaC 2.5 μM, ##p < 0.01 vs. BavaC 2.5 μM. |
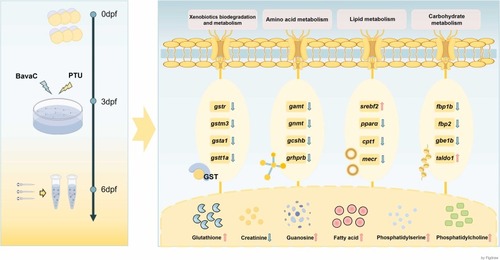
Speculated molecular mechanisms of PTU increasing the hepatotoxicity of BavaC. |