
Image
|
Figure Caption
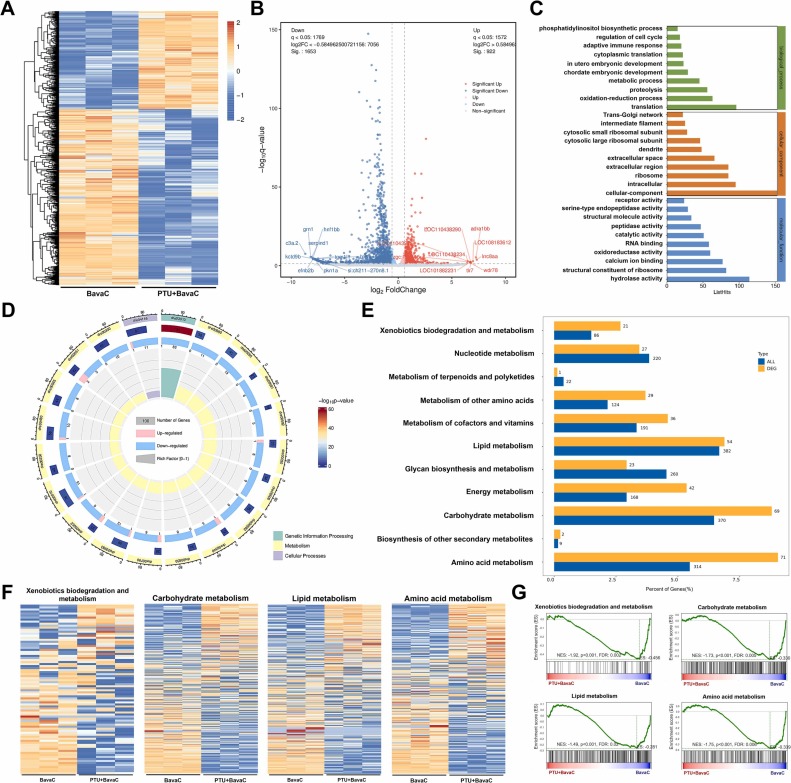
Fig. 4 Effect of PTU combined with BavaC on gene expression profiles in zebrafish: (A): Cluster map of differentially expressed gene groups. (B): Volcano plot of differentially expressed genes. (C): GO enrichment analysis plot of differentially expressed genes. (D): Circle plot of the KEGG enrichment analysis. (E): KEGG enrichment bar chart for differentially expressed genes. (F): GSEA gene group cluster map. (G): GSEA enrichment map.
Acknowledgments
This image is the copyrighted work of the attributed author or publisher, and
ZFIN has permission only to display this image to its users.
Additional permissions should be obtained from the applicable author or publisher of the image.
Full text @ Ecotoxicol. Environ. Saf.