
|
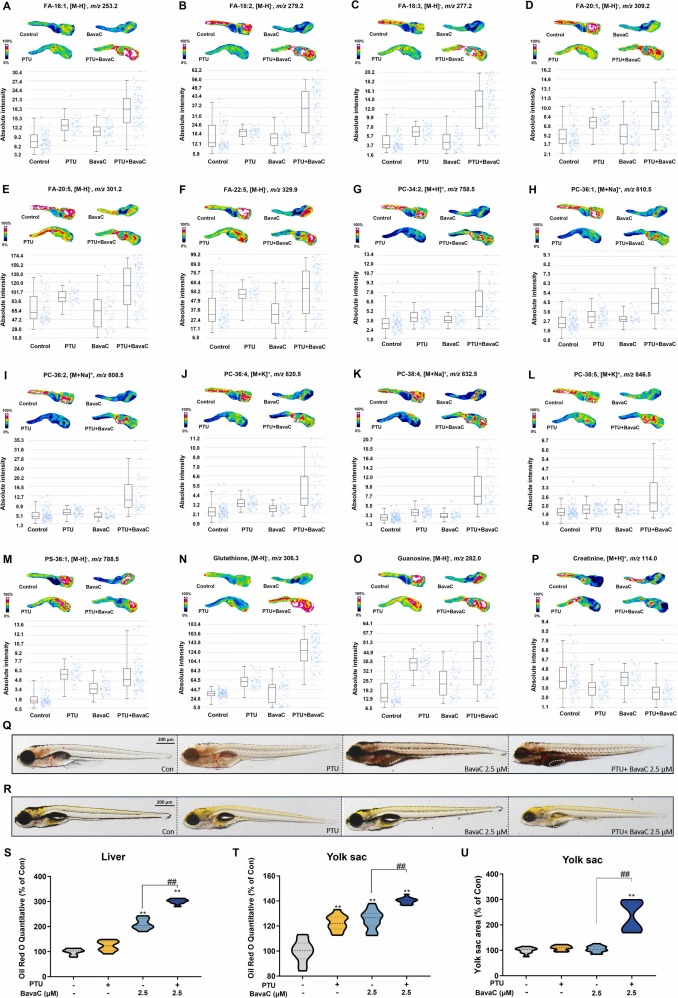
Fig. 3 Effect of PTU combined with BavaC on endogenous metabolites and oil red O staining in zebrafish: (A-P): MALDI-MS images and metabolite expression level statistics. (Q): Oil red O staining; the red line indicates the liver, and the white line indicates the yolk sac. (R): Bright field images of zebrafish; the white line indicates the yolk sac. (S): Quantitative statistics of the oil red O staining results for the liver (n = 10). (T): Quantitative statistics of the oil red O staining results for the yolk sac (n = 10). (U): Statistics of the yolk sac area (n = 15). * *p < 0.01 vs. Con, ##p < 0.01 vs. BavaC 2.5 μM. FA: fatty acids; PC: phosphatidylcholine; PS: phosphatidylserine.