
|
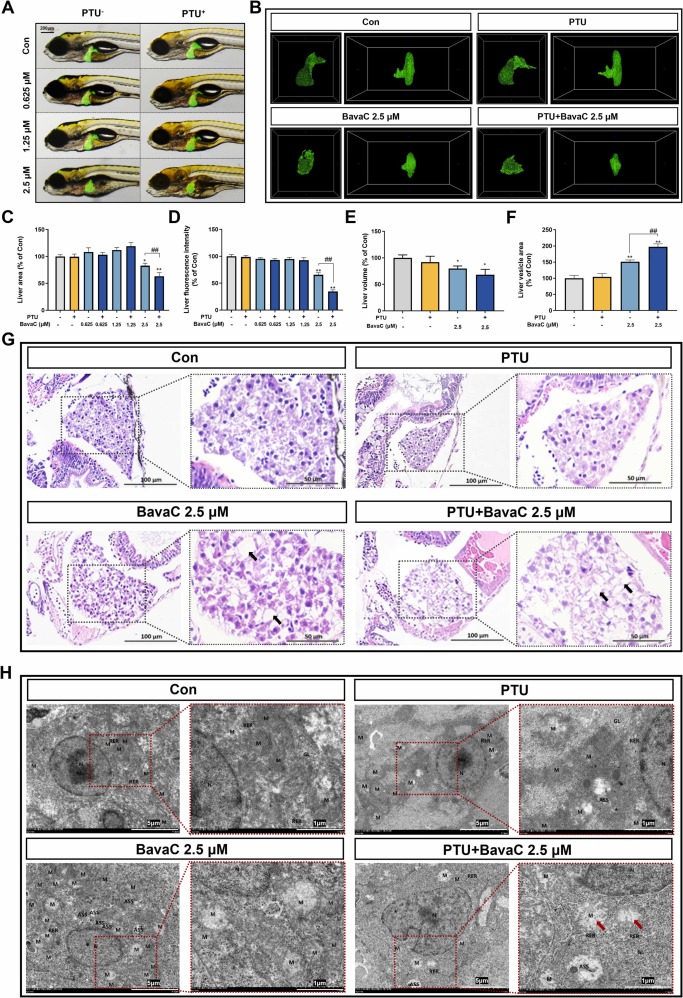
Fig. 2 Effect of PTU combined with BavaC on the morphology, pathological structure and ultrastructure of zebrafish livers: (A): Zebrafish liver, 2D morphology. (B): Zebrafish liver, 3D morphology. (C): Zebrafish liver area statistics (n = 15). (D): Zebrafish liver fluorescence intensity statistics (n = 15). (E): Zebrafish liver volume statistics (n = 15). (F): Zebrafish liver vesicle area statistics (n = 5). (G): HE-stained pathological tissue sections; black arrows indicate vacuoles. (H): Ultrastructural electron microscopy images of the nucleus (N), mitochondria (M), rough endoplasmic reticulum (RER), lysosome (Ly) and autolysosome (ASS); red arrows indicate diseased mitochondria. *p < 0.05 vs. Con, * *p < 0.01 vs. Con, ##p < 0.01 vs. BavaC 2.5 μM.