
Image
|
Figure Caption
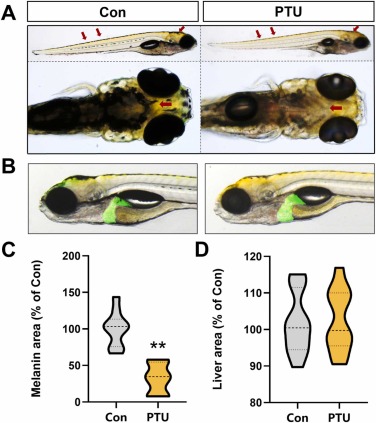
Fig. 1 Effect of 200 μM PTU on zebrafish: (A): Zebrafish melanogenesis; red arrows indicate melanin. (B): Zebrafish liver morphology; green fluorescence indicates the liver. (C): Zebrafish head melanin area statistics (n = 15). (D): Zebrafish liver area statistics (n = 15). * *p < 0.01 vs. Con.
Acknowledgments
This image is the copyrighted work of the attributed author or publisher, and
ZFIN has permission only to display this image to its users.
Additional permissions should be obtained from the applicable author or publisher of the image.
Full text @ Ecotoxicol. Environ. Saf.