FIGURE SUMMARY
Title

Chr23-miR-200s and Dmrt1 Control Sexually Dimorphic Trade-Off Between Reproduction and Growth in Zebrafish

Authors
Ge, S., Liu, Y., Huang, H., Yu, J., Li, X., Lin, Q., Huang, P., Mei, J.
Source
Full text @ Int. J. Mol. Sci.

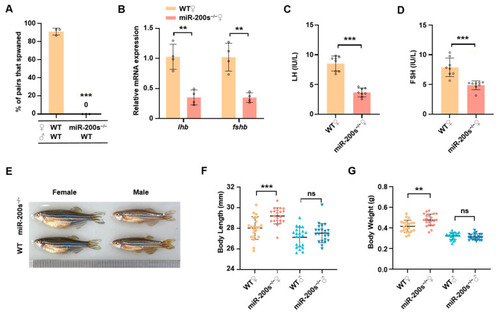
Impaired reproduction and promoted growth in female chr23-miR-200s-KO zebrafish. (A) Successful spawning rate of WT and chr23-miR-200s-KO (miR-200s−/−) females mating naturally with WT males. There were three independent repetitions (n = 15 for each). (B) mRNA expression lhb and fshb in the pituitary of female zebrafish. (C,D) LH and FSH levels in plasma of adult female zebrafish (n = 8). (E) Representative morphological images of WT and miR-200s−/− zebrafish. (F,G) Statistics of body length and body weight of 3-month-old miR-200s−/− and WT zebrafish (n = 22). Data are represented as mean ± SD (p < 0.01 **; p < 0.001 ***; ns, no significant).

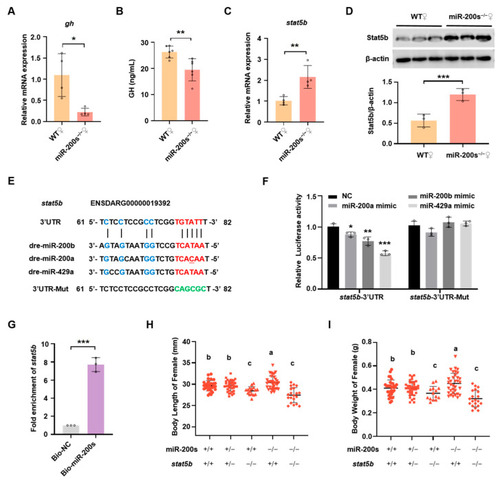
Chr23-miR-200s regulate growth of female zebrafish through targeting stat5b 3′UTR. (A) QRT-PCR analysis of gh expression levels in pituitary of WT and chr23-miR-200s-KO (miR-200s−/−) female zebrafish. (B) ELISA analysis of plasma GH in miR-200s−/− and WT female zebrafish. (C) Stat5b mRNA expression levels in liver of female fish. (D) Western blot analysis of Stat5b expression in liver. Representative images (top) and the quantitation (bottom; n = 3 per assay). (E) MiR-200b/200a/429a seed region and predicted target sites within 3′UTR of stat5b, and the mutated 3′UTR sequence of stat5b (3′UTR-Mut). The seed sequence pairing regions are marked in red, while other pairing base sequences are marked in blue, and the green bases indicate the mutated pairing region in 3′UTR of stat5b. (F) Validation of potential target of miR-200s by a dual-luciferase reporter assay in HEK-293T cells. NC stands for the negative control. Data are represented as mean ± SD (p < 0.05 *, p < 0.01 **; p < 0.001 ***). (G) Fold enrichment of stat5b by using qRT-PCR in the sample pulled down by biotinylated miR-200s (miR-200b/-200a/-429a) and negative control (NC). (H,I) Statistics of body length (H) and body weight (I) of female self-bred offspring of chr23-miR-200s-KO and stat5b double heterozygotes at 3 mpf. The groups with different letters indicate that they are statistically significant (p < 0.05).

Dmrt1 regulates gonad development in males but not in females. (A) Anatomical observation of testes in WT and dmrt1−/− at 5 mpf. The black and blue arrowheads indicate the testes in WT and dmrt1−/− zebrafish, respectively. (B) Histological examination of testes in 5-month-old WT and dmrt1−/− zebrafish. Transverse section of the abdomen by HE staining. The black and blue arrowheads indicate the testes in WT and the severely regressed testicular tissue in dmrt1−/− zebrafish, while the blue dotted lines show the amplified images of testes in dmrt1−/− zebrafish. Scale bars, 1 mm. (C) Immunofluorescence staining of WT and dmrt1−/− testis transverse sections with Ddx4 antibody (green). The nuclei were stained by DAPI (blue). The white dotted lines show the testes in dmrt1−/− zebrafish. Scale bars, 50 μm. (D) Anatomical observation of ovary in 5-month-old WT and dmrt1−/− zebrafish. (E) Successful spawning rate of WT and dmrt1−/− females mating naturally with WT males at 5 mpf. There were three independent repetitions (n = 15). (F) Fertilization rate of WT and dmrt1−/− females by crossing with WT males at 5 mpf (n = 15). Data are represented as mean ± SD (ns, no significant).

Dmrt1 knockout leads to impaired reproduction and promoted growth in male zebrafish. (A) mRNA expression of lhb and fshb in the pituitary of WT and dmrt1−/− male zebrafish. (B,C) LH and FSH levels in plasma of adult male zebrafish (n = 6). (D) Morphological comparison of WT and dmrt1−/− zebrafish at 5 mpf. (E,F) Statistics of body length and body weight of WT and dmrt1−/− zebrafish at 5 mpf (n = 13). Data are represented as mean ± SD (p < 0.05 *, p < 0.01 **; p < 0.001 ***; ns, no significant).

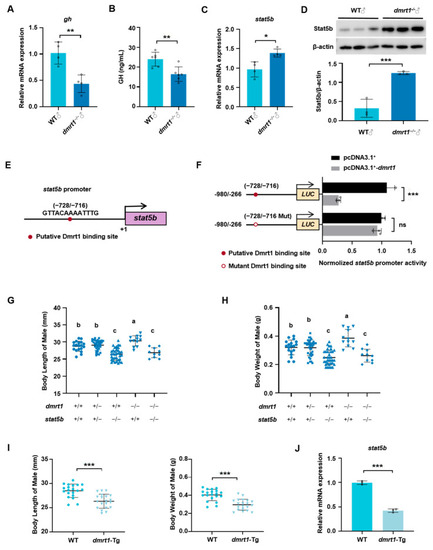
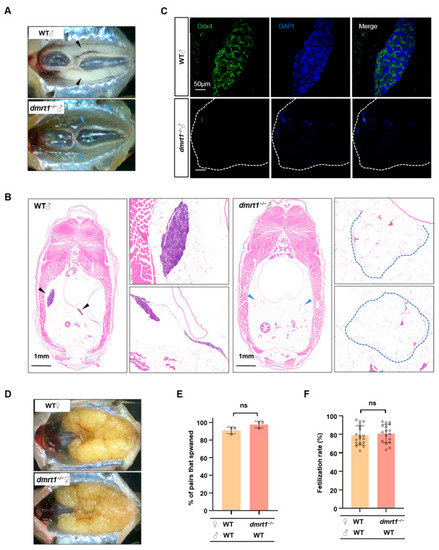
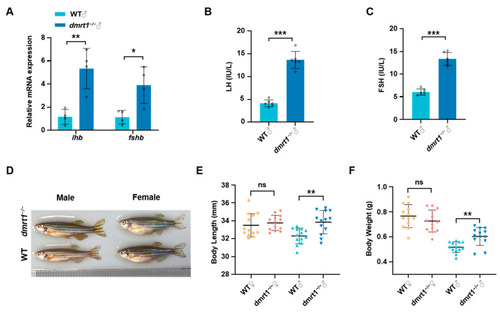
Dmrt1 regulates somatic growth in male zebrafish by mediating stat5b expression. (A,B) Gh mRNA levels in pituitary (A) and plasma GH levels (B) of WT and dmrt1−/− male zebrafish at 5 mpf. (C,D) Relative expression of stat5b mRNA (C) and Stat5b protein (D) in liver. Representative images of Western blot (top) and the quantitation (bottom; n = 3 per assay). (E) Binding site of transcription factor Dmrt1 in the stat5b promoter region predicted by JASPAR. (F) Schematic representation of the normal and mutational stat5b promoter luciferase constructs and their activities in dual-luciferase assay. Dmrt1 overexpression inhibited the luciferase activity of stat5b promoter in HEK-293T cells. The empty vector pcDNA3.1+ and pGL3-basic were transfected as the control. (G,H) The body length and body weight of male self-bred offspring of dmrt1 and stat5b double heterozygotes at 3 mpf. The groups with different letters indicate that they are statistically significant (p < 0.05). (I) The body length and body weight of male dmrt1 transgenic line at 3 mpf (n = 20). (J) Relative expression of stat5b mRNA in liver of dmrt1 transgenic male fish. Data are represented as mean ± SD (p < 0.05 *, p < 0.01 **; p < 0.001 ***; ns, no significant).

Acknowledgments
This image is the copyrighted work of the attributed author or publisher, and ZFIN has permission only to display this image to its users. Additional permissions should be obtained from the applicable author or publisher of the image. Full text @ Int. J. Mol. Sci.