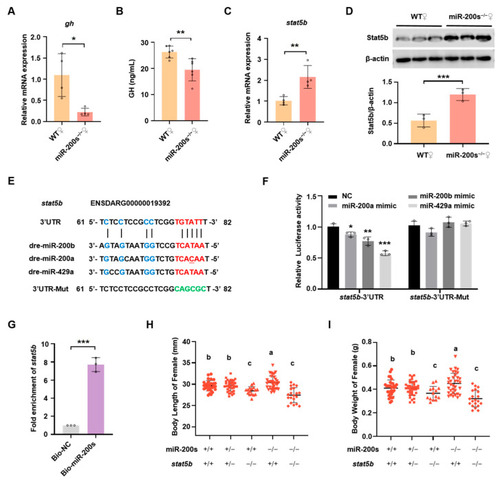
Chr23-miR-200s regulate growth of female zebrafish through targeting stat5b 3′UTR. (A) QRT-PCR analysis of gh expression levels in pituitary of WT and chr23-miR-200s-KO (miR-200s−/−) female zebrafish. (B) ELISA analysis of plasma GH in miR-200s−/− and WT female zebrafish. (C) Stat5b mRNA expression levels in liver of female fish. (D) Western blot analysis of Stat5b expression in liver. Representative images (top) and the quantitation (bottom; n = 3 per assay). (E) MiR-200b/200a/429a seed region and predicted target sites within 3′UTR of stat5b, and the mutated 3′UTR sequence of stat5b (3′UTR-Mut). The seed sequence pairing regions are marked in red, while other pairing base sequences are marked in blue, and the green bases indicate the mutated pairing region in 3′UTR of stat5b. (F) Validation of potential target of miR-200s by a dual-luciferase reporter assay in HEK-293T cells. NC stands for the negative control. Data are represented as mean ± SD (p < 0.05 *, p < 0.01 **; p < 0.001 ***). (G) Fold enrichment of stat5b by using qRT-PCR in the sample pulled down by biotinylated miR-200s (miR-200b/-200a/-429a) and negative control (NC). (H,I) Statistics of body length (H) and body weight (I) of female self-bred offspring of chr23-miR-200s-KO and stat5b double heterozygotes at 3 mpf. The groups with different letters indicate that they are statistically significant (p < 0.05).
|
