
- Title
-
Dual targeted lipid nanoparticles for enhanced DNA delivery and transfection of breast cancer cells
- Authors
- Lotter, C., Stierli, M.A., Puligilla, R.D., Huwyler, J.
- Source
- Full text @ Eur J Pharm Biopharm
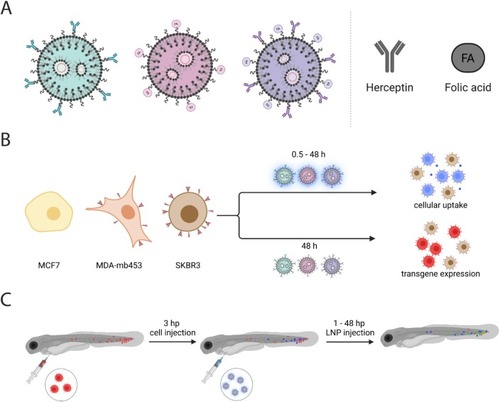
Design of targeted LNPs and their in vitro and in vivo evaluation. A) DNA-LNPs decorated with different targeting ligands: Herceptin (Her; turquoise), folate (FA; pink), and both (Dual; purple), respectively. B) Targeted LNPs were analyzed regarding their efficiency to specifically bind and transfect different breast cancer cell lines in vitro: MCF7 (yellow, low HER2 expression), MDA-mb453 (orange, intermediate HER2 expression), and SKBR3 (brown, strong HER2 expression). C) Xenograft zebrafish larvae (Danio rerio) were used to analyze the LNP targeting capacity in vivo. (For interpretation of the references to colour in this figure legend, the reader is referred to the web version of this article.) |

Design and physico-chemical characterization of targeted LNPs. A) Schematic representation of the targeted LNP production: a lipid phase in ethanol containing MC3, Cholesterol, DSPC, DSPE-PEG2000, DSPE-PEG2000 folate (FA), DSPE-PEG2000 maleimide in different molar ratios were mixed with an aqueous phase containing plasmid DNA using a microfluidic mixer (N/P ratio = 6). Subsequently, Herceptin (Her) was coupled to maleimide moieties via Michael addition. Purified samples were analyzed using dynamic light scattering to determine the hydrodynamic diameter (DH, B), the polydispersity index (PDI, C), and ?-potentials at pH 7.4 (D). Results are shown for Her- (turquoise), FA- (pink), and Dual- (purple) LNPs. Values are means � SD, n ? 3. E) Representative cryogenic transmission electron microscopy (cryo-TEM) images of Her-, FA-, and Dual-LNPs. Black arrows show bleb structures and turquoise arrows show conjugated Herceptin on the surface of the LNPs. Scale bar = 100 �m. (For interpretation of the references to colour in this figure legend, the reader is referred to the web version of this article.) |
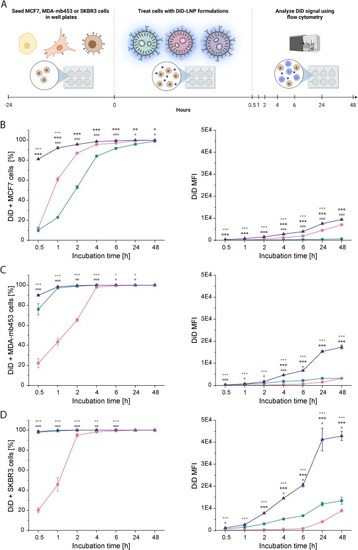
Cellular uptake of targeted LNPs in vitro. A) Schematic representation of the experimental setup to examine the targeting efficiency of targeted LNPs in vitro. The breast cancer cell lines MCF7 (yellow, low HER2 expression), MDA-mb453 (orange, intermediate HER2), and SKBR3 (brown, strong HER2 expression) were incubated with DiD-labeled targeted LNPs (Her-, FA-, and Dual-LNPs; 2.5 pg encapsulated DNA/initially plated cells). Cellular uptake of DiD-labeled LNPs was evaluated in terms of percentage of cells that have taken up DiD-labeled LNPs (left panel), and DiD median fluorescence intensity (MFI) (right panel) for MCF7 cells (B), MDA-mb453 cells (C), and SKBR3 cells (D). Results are shown for Her- (turquoise), FA- (pink), and Dual- (purple) LNPs. Values are means � SD, n = 3. Statistical comparisons are indicated using the following symbols: * for Her- vs. Dual-LNPs, + for FA- vs. Dual-LNPs, and � for Her- vs. FA-LNPs. Levels of significance *p ? 0.05, **p ? 0.01, ***p ? 0.001. (For interpretation of the references to colour in this figure legend, the reader is referred to the web version of this article.) |
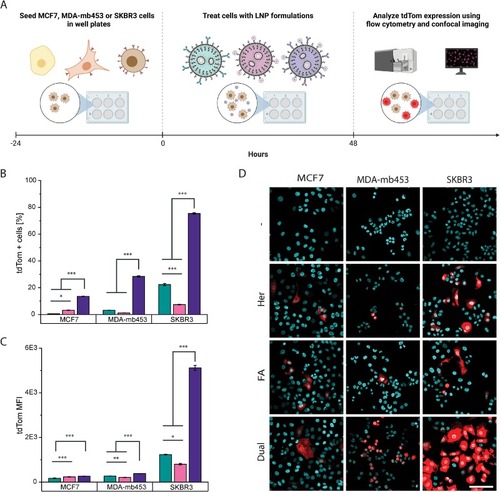
In vitro transgene expression of targeted LNPs in MCF7, MDA-mb453, and SKBR3 breast cancer cells. A) Schematic representation of the experimental setup to examine the transfection efficiency of targeted LNPs. Breast cancer cells ? MCF7 (yellow, low HER2 expression), MDA-mb453 (orange, intermediate HER2 expression), and SKBR3 (brown, high HER2 expression) ? were plated in 24-well plates and treated with targeted LNPs (Her-, FA-, and Dual-LNPs; 2.5 pg encapsulated DNA/initially plated cells) for 48 h. Transgene expression was assessed using flow cytometry and confocal microscopy. Flow cytometry was used to simultaneously analyze B) the percentage of transfected cells expressing the transgene tdTomato (tdTom), and C) the tdTom median fluorescence intensity (MFI). Results are shown for Her- (turquoise), FA- (pink), and Dual- (purple) LNPs. Values are means of triplicates � SD, n = 3. Levels of significance: *p ? 0.05, **p ? 0.01, ***p ? 0.001. D) Representative confocal images of tdTom transgene expression (red) in different breast cancer cell lines. Cell nuclei were stained using Hoechst 3342 (cyan). Results are shown for untreated cells, and cells treated for 48 h with either Her-, FA-, or Dual-LNPs. Scale bar = 100 �m. (For interpretation of the references to colour in this figure legend, the reader is referred to the web version of this article.) |
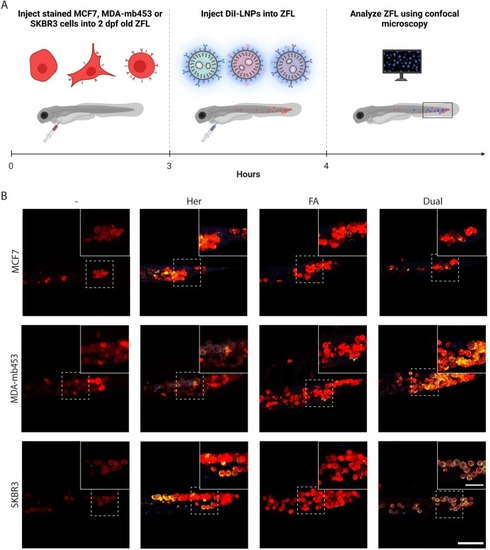
In vivo targeting efficiency of LNPs in a xenograft zebrafish larvae (ZFL) model. A) Schematic representation of the experimental setup to examine the targeting efficiency of targeted LNPs in vivo. Breast cancer cells ? MCF7 (low HER2 expression), MDA-mb453 (intermediate HER2 expression), and SKBR3 (strong HER2 expression) ? were stained with CellTracker Deep Red stain and injected into 2 days post-fertilization (dpf) old ZFL to reach a final concentration of 250 cells per ZFL. 3 hp cell injection ZFL were further treated with DiI-labeled LNPs (Her-, FA-, and Dual-LNPs; 0.75 pg encapsulated DNA/ZFL) and imaged 1 hp LNP injection. B) Representative confocal images of tail region of ZFL, showing breast cancer cells (red) and DiI-labeled LNPs (blue). Overlap of MCF7, MDA-mb453, and SKBR3 cells with DiI-labeled LNPs is colored in yellow. Insert: magnified section of dotted area. Results are shown for control ZFL and Her-, FA-, and Dual-LNP treated ZFL 3 hp cell and 1 hp LNP injection. Scale bar = 100 �m. Scale bar inserts = 50 �m. (For interpretation of the references to colour in this figure legend, the reader is referred to the web version of this article.) |

In vivo transgene expression of LNPs in MCF7 xenograft zebrafish larvae (ZFL) model. A) Schematic representation of the experimental setup to examine the transfection efficiency of targeted LNPs in vivo. Low HER2 expressing MCF7 cells were stained with CellTracker Deep Red and injected into 2 dpf ZFL. At 3 hp cell injection, DiI-labeled LNPs (Her-, FA-, and Dual-LNPs; 0.75 pg encapsulated EGFP encoding DNA/ZFL) were injected and imaged 45 hp LNP injection. B) Representative confocal images of tail region of ZFL showing MCF7 cells (red), DiI-labeled LNPs (blue), and EGFP transgene expression (green). Insert: magnified section of dotted area. Results are shown for control ZFL and Her-, FA-, and Dual-LNP treated ZFL 48 hp cell and 45 hp LNP injection. Scale bar = 100 �m. Scale bar inserts = 50 �m. (For interpretation of the references to colour in this figure legend, the reader is referred to the web version of this article.) |