
|
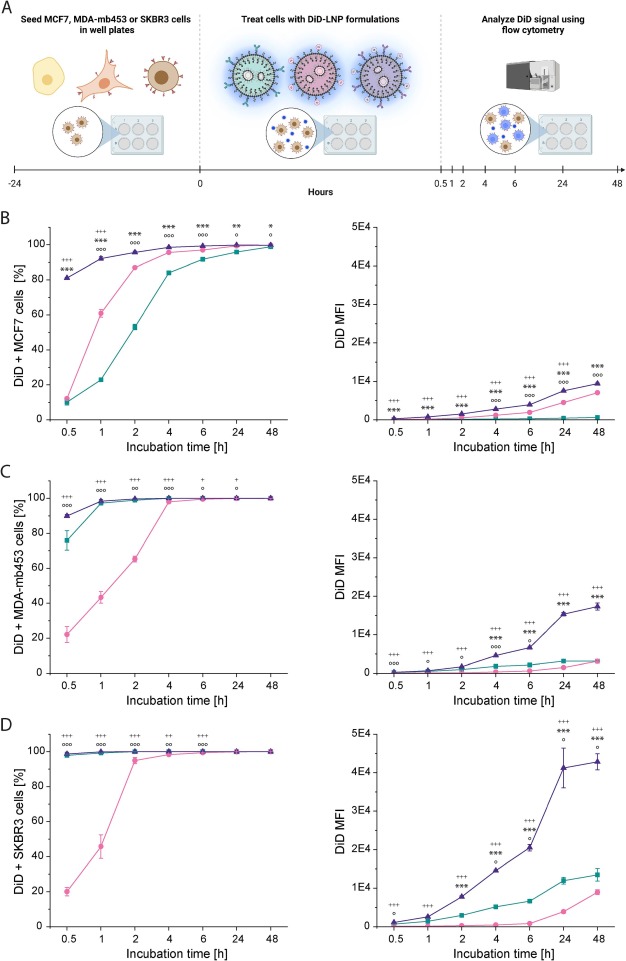
Fig. 3 Cellular uptake of targeted LNPs in vitro. A) Schematic representation of the experimental setup to examine the targeting efficiency of targeted LNPs in vitro. The breast cancer cell lines MCF7 (yellow, low HER2 expression), MDA-mb453 (orange, intermediate HER2), and SKBR3 (brown, strong HER2 expression) were incubated with DiD-labeled targeted LNPs (Her-, FA-, and Dual-LNPs; 2.5 pg encapsulated DNA/initially plated cells). Cellular uptake of DiD-labeled LNPs was evaluated in terms of percentage of cells that have taken up DiD-labeled LNPs (left panel), and DiD median fluorescence intensity (MFI) (right panel) for MCF7 cells (B), MDA-mb453 cells (C), and SKBR3 cells (D). Results are shown for Her- (turquoise), FA- (pink), and Dual- (purple) LNPs. Values are means ± SD, n = 3. Statistical comparisons are indicated using the following symbols: * for Her- vs. Dual-LNPs, + for FA- vs. Dual-LNPs, and ° for Her- vs. FA-LNPs. Levels of significance *p ≤ 0.05, **p ≤ 0.01, ***p ≤ 0.001. (For interpretation of the references to colour in this figure legend, the reader is referred to the web version of this article.)