
|
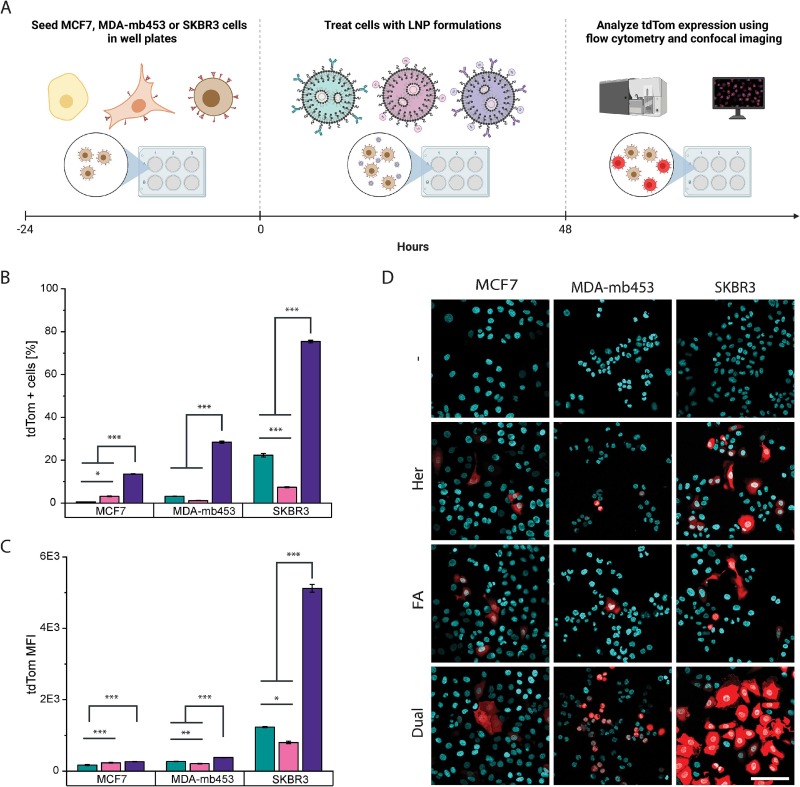
Fig. 4 In vitro transgene expression of targeted LNPs in MCF7, MDA-mb453, and SKBR3 breast cancer cells. A) Schematic representation of the experimental setup to examine the transfection efficiency of targeted LNPs. Breast cancer cells − MCF7 (yellow, low HER2 expression), MDA-mb453 (orange, intermediate HER2 expression), and SKBR3 (brown, high HER2 expression) − were plated in 24-well plates and treated with targeted LNPs (Her-, FA-, and Dual-LNPs; 2.5 pg encapsulated DNA/initially plated cells) for 48 h. Transgene expression was assessed using flow cytometry and confocal microscopy. Flow cytometry was used to simultaneously analyze B) the percentage of transfected cells expressing the transgene tdTomato (tdTom), and C) the tdTom median fluorescence intensity (MFI). Results are shown for Her- (turquoise), FA- (pink), and Dual- (purple) LNPs. Values are means of triplicates ± SD, n = 3. Levels of significance: *p ≤ 0.05, **p ≤ 0.01, ***p ≤ 0.001. D) Representative confocal images of tdTom transgene expression (red) in different breast cancer cell lines. Cell nuclei were stained using Hoechst 3342 (cyan). Results are shown for untreated cells, and cells treated for 48 h with either Her-, FA-, or Dual-LNPs. Scale bar = 100 µm. (For interpretation of the references to colour in this figure legend, the reader is referred to the web version of this article.)