
|
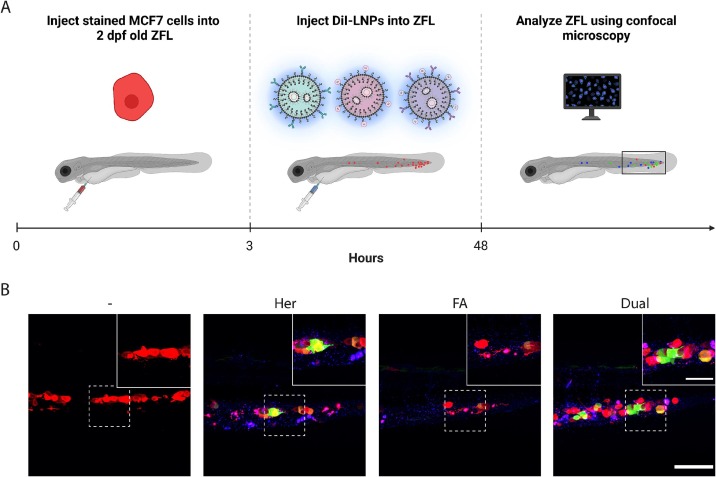
Fig. 6 In vivo transgene expression of LNPs in MCF7 xenograft zebrafish larvae (ZFL) model. A) Schematic representation of the experimental setup to examine the transfection efficiency of targeted LNPs in vivo. Low HER2 expressing MCF7 cells were stained with CellTracker Deep Red and injected into 2 dpf ZFL. At 3 hp cell injection, DiI-labeled LNPs (Her-, FA-, and Dual-LNPs; 0.75 pg encapsulated EGFP encoding DNA/ZFL) were injected and imaged 45 hp LNP injection. B) Representative confocal images of tail region of ZFL showing MCF7 cells (red), DiI-labeled LNPs (blue), and EGFP transgene expression (green). Insert: magnified section of dotted area. Results are shown for control ZFL and Her-, FA-, and Dual-LNP treated ZFL 48 hp cell and 45 hp LNP injection. Scale bar = 100 µm. Scale bar inserts = 50 µm. (For interpretation of the references to colour in this figure legend, the reader is referred to the web version of this article.)