
- Title
-
Computational functions of precisely balanced neuronal microcircuits in an olfactory memory network
- Authors
- Meissner-Bernard, C., Jenkins, B., Rupprecht, P., Bouldoires, E.A., Zenke, F., Friedrich, R.W., Frank, T.
- Source
- Full text @ Cell Rep.
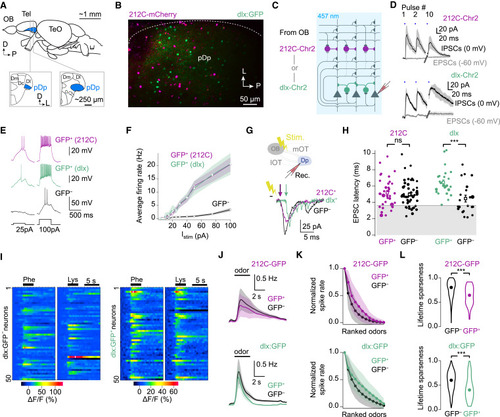
Properties of fast-spiking inhibitory interneurons in pDp (A) Lateral view of the adult zebrafish brain and coronal cross-sections of the telencephalon (Tel), showing pDp. OB, olfactory bulb; TeO, optic tectum; Dm, Dc, and Dl, medial, central, and lateral dorsal Tel, respectively. (B) Marker expression in pDp of 212C/dlx double-transgenic fish (Tg[SAGFF212C:Gal4,UAS:mCherry,dlx4/6:GFP], maximum-intensity projection). (C) Optogenetic stimulation of interneurons and whole-cell patch-clamp recording of IPSCs and EPSCs in principal neurons. (D) Mean IPSCs (0 mV) and EPSCs (−60 mV) evoked by 10 0.5-ms full-field blue-light pulses (457 nm, blue bars, 20 Hz) in 212C-Chr2YFP (n = 4) and dlx-Chr2YFP (n = 2; see also Figure S1F). Shading: SEM. (E) Firing patterns of interneurons (GFP+) and a principal neuron (GFP−) evoked by current injections. (F) Mean firing rates as a function of injected current. Shading: SEM. (G) Medial olfactory tract (mOT) stimulation and whole-cell recording in pDp. (H) EPSC latency distribution for interneurons and principal neurons. dlx:GFP+ latencies, but not 212C-GFP+ latencies, were longer than the corresponding GFP− latencies (Wilcoxon rank-sum test: dlx:GFP+: p = 0.0003, n = 27 vs. dlx:GFP−, n = 21; 212C-GFP+: p = 0.63, n = 34 vs. 212C-GFP−, n = 53). Squares: mean ± SEM. (I) Responses of 50 randomly selected GFP− (left) and dlx:GFP+ (right) cells to two amino acid odors (10−5 M). (J) Odor-evoked firing rates inferred from Ca2+ signals averaged over all trials (n = 2), odors (n = 12), and neurons (212C-GFP: n = 1515 GFP− and n = 50 GFP+ from N = 5 fovs; dlx:GFP: n = 1750 GFP− and n = 65 GFP+ from N = 12 fovs). Shading: SD. (K) Mean rank-ordered tuning curves of GFP+ (interneurons) and GFP− (principal) neurons. Shading: SD. (L) Lifetime sparseness of odor responses (same neurons as in J; Wilcoxon rank-sum test; 212C: p < 10−6; dlx: p < 10−6). Circles: median. |
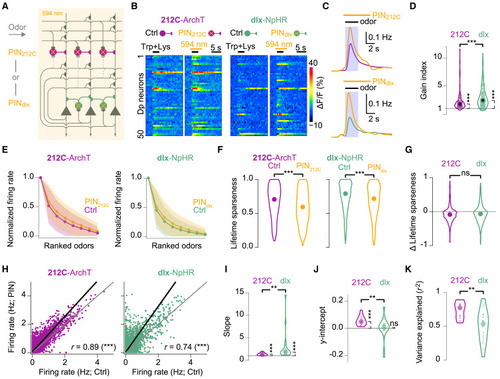
Modulation of odor responses by inhibitory interneurons in pDp (A) Photoinhibition (PIN) of 212C or dlx interneurons during odor stimulation and 2-photon Ca2+ imaging in 212C-ArchTGFP or dlx-NpHR3YFP fish. (B) Odor-evoked Ca2+ signals in 50 randomly selected pDp neurons under control (Ctrl) and PIN conditions (average of 2 trials). Bars: light exposure and odor stimulation. (C) Inferred firing rates averaged over neurons, trials, and odors under Ctrl and PIN (orange) conditions (212C: n = 1,190; dlx: n = 1,788). Shaded area: 3-s window used for most analyses. Top: 212C; bottom: dlx. (D) Gain index (mean activity during PIN normalized to Ctrl). Circles: fov-odor combinations. Gain indices differed significantly from unity (bootstrap test, one sided; 212C: p < 10−5, n = 96; dlx: p < 10−5, n = 152) and between lines (Wilcoxon rank-sum test: p < 10−4). Black circles: median. (E) Rank-ordered odor tuning curves averaged across neurons; same neurons as in (C). Shading: SD. (F) Lifetime sparseness of odor responses (Wilcoxon signed-rank test, two sided; same neurons as in C; 212C: p < 10−15; dlx: p < 10−15; 212C vs. dlx: p = 0.09). Circles (F and G): median. (G) Distribution of changes in lifetime sparseness (PIN – Ctrl). (H) Amplitudes of individual odor responses under Ctrl and PIN conditions for each neuron-odor pair (212C: n = 10,710, N = 12 fovs; dlx: n = 16,092, N = 19 fovs). Black line: linear fit (total least squares). (I) Slopes of linear fits for each fov (difference from unity: bootstrap test, one-sided; 212C: p < 10−5, N = 12; dlx: p < 10−5, N = 19; difference between 212C and dlx: Wilcoxon rank-sum test: p = 0.004). Large circles (I–K): median. (J) y intercepts of linear fits for each fov (same fovs as in I; 212C: p < 10−5; dlx: p = 0.89; difference between 212C and dlx: p = 0.007). (K) Variance explained by linear fits in individual fovs (Wilcoxon rank-sum test: p = 0.006). |
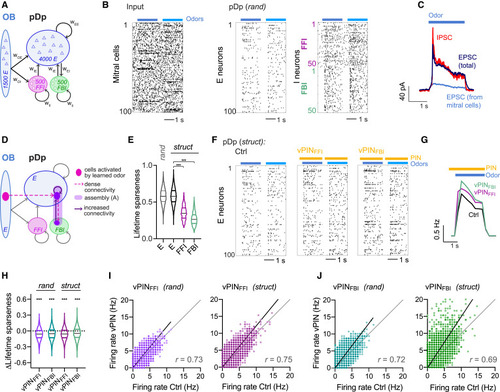
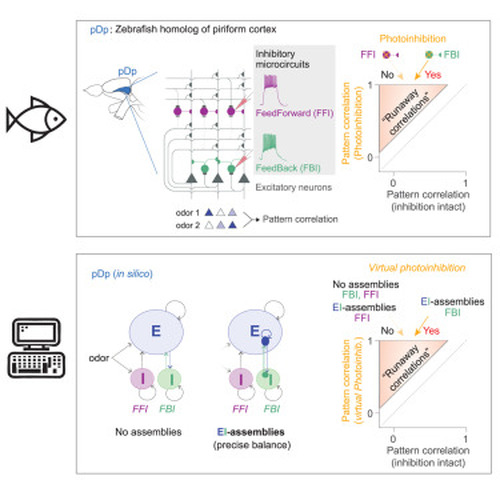
Computational model of pDp (A) pDpsim. (B) Spike raster of randomly selected subsets of 100 mitral cells (afferent input), 100 E neurons, 50 FFI neurons, and 50 FBI neurons. Two odors (bars) were applied by changing the firing rates of specific mitral cell subsets for 2 s. (C) EPSCs (black) and IPSCs (red) averaged across odors and E neurons. Blue: mitral cells (afferent) contribution to EPSCs. (D) EI assembly in a struct network. (E) Lifetime sparseness of E neurons in rand networks and E, FFI, and FBI neurons in struct networks (n = 4,000, n = 8,000, n = 1,000, and n = 1,000 from left to right). E neurons were more sharply tuned than FFI (Wilcoxon rank-sum test: p < 0.0001) and FBI (p < 0.0001) neurons. (F) Spike raster of the 100 E neurons in (B) in a corresponding struct network under Ctrl, vPINFFI, and vPINFBI conditions. (G) Firing rate averaged over all odors and E neurons. Bars depict odor presentation (blue) and vPIN (yellow). (H) vPIN-induced change in lifetime sparseness (vPIN – Ctrl; Wilcoxon signed-rank test for difference from zero: p < 0.0001 for all). (I) Odor-evoked firing rates of individual neurons during vPINFFI as a function of their Ctrl firing rates in rand and struct networks (20 odors, 200 neurons, 10 networks). (J) Same as (I) for vPINFBI. |
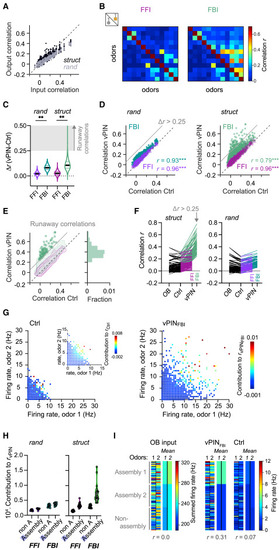
Runaway correlations during imbalanced FBI in networks with EI assemblies (A) Pearson correlations between odor-evoked activity patterns across E neurons (output correlation) as a function of the correlation between the corresponding afferent activity patterns (input correlation) in rand and struct networks. (B) Example of pattern correlations for 12 odors under Ctrl conditions (below diagonal) and during vPINFFI and vPINFBI (above diagonal) in one struct network. (C) vPIN-induced changes in pattern correlation r (n = 190 odor pairs, 10 rand and 20 struct networks; Wilcoxon signed-rank test: p < 0.0001). Shading depicts Δr > 0.25, the operational criterion for runaway correlations. (D) Pattern correlations during vPINFFI and vPINFBI as a function of correlations under Ctrl conditions in rand and struct networks. Datapoints above the gray line (Δr > 0.25) fulfill the criterion for runaway correlations. (E) vPIN-induced changes in correlation in struct networks. Contour plots show distributions of correlations (same data as in D; logarithmic contour levels). Datapoints show runaway correlations; the histogram shows relative frequency. No runaway correlations occurred during vPINFFI. (F) Odor pair-network combinations were selected for occurrence of runaway correlations (Δr > 0.25 during vPINFBI) in struct networks. Left: runaway correlations compared to the correlations between input patterns and output patterns under Ctrl and vPINFFI conditions. Lines connect the datapoints from the same odor pair-network combinations. Right: correlations in the corresponding rand networks. (G) Contribution of individual neurons to high pattern correlations during vPINFBI. Each datapoint shows the firing rates evoked by two odors in one neuron under Ctrl conditions or during vPINFBI and the neuron’s contribution to the corresponding pairwise pattern correlation during vPINFBI (color code). Inset (left): the color code indicates a neuron’s contribution during Ctrl conditions. N = 87 odor pairs from 10 networks, 80 randomly selected neurons for each odor pair (STAR Methods). (H) Contribution of E neurons to all pattern correlations, averaged over assembly neurons and neurons outside assemblies (non-A). (I) Example of activity patterns evoked by two dissimilar odors across E neurons from two assemblies and outside assemblies (left: 30 randomly selected neurons per group; right: mean activity of each group). Left: OB input. Right: activity under Ctrl conditions and during vPINFBI. Assembly 1 received stronger mean input from both odors than assembly 2 and neurons outside assemblies. Note the increased pattern correlation r due to nonlinear amplification of activity in assembly 1 during vPINFBI. |

Nonlinear amplification in assemblies (A) Mean firing rate of assembly E neurons or the corresponding pseudo-assembly neurons as a function of mean afferent input to (pseudo-)assemblies (summed firing rates of all connected mitral cells). Data are from one rand and its corresponding struct network (n = 20 odors, 20 [pseudo]-assemblies). Lines: exponential fits; vertical dotted line: threshold for “activation” in (D). (B) Gain index of assemblies (mean activity during vPIN normalized by Ctrl) as a function of input strength (same networks as in A). Each datapoint represents an assembly-odor pair (rand not shown for clarity), and the lines are linear fits (rand: FFI: r = −0.34, p < 0.0001: FBI: r = −0.25, p < 0.0001; struct: FFI: r = −0.18, p = 0.0003; FBI: r = 0.11, p = 0.023). (C) Gain index as a function of the mean Dp firing rate during vPIN. Each datapoint corresponds to the gain index in response to one odor averaged over 20 struct networks. Lines: linear fits (rand: FFI: r = −0.23, p = 0.33; FBI: r = 0.46, p = 0.04; struct: FFI: r = −0.22, p = 0.35; FBI: r = 0.72, p = 0.0003). (D) Cumulative frequency of shared assembly activation in odor pair-network combinations that exhibited runaway correlations during vPINFBI (Δr > 0.25; dashed line) or not (solid line). An assembly was defined as “activated” when the total afferent input exceeded 240 Hz (vertical line in A). |
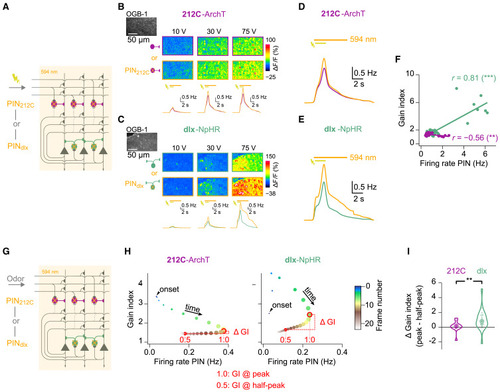
Functional signatures of EI assemblies in pDp: Nonlinear amplification (A) Electrical stimulation of mOT (20 pulses, 10 Hz) during 2-photon Ca2+ imaging and PIN. (B) Raw fluorescence (OGB-1) and evoked Ca2+ signals under Ctrl and PIN212C (212C-ArchTGFP) conditions for three stimulus amplitudes (single trials). Bottom: inferred firing rates averaged across neurons (n = 903; N = 12 fovs) and trials (n = 2). Bars: mOT stimulation (2 s) and 594 nm illumination for PIN (6.8 s). (C) Same for PINdlx (dlx-eNpHR3.0YFP; n = 2,358 neurons; N = 18 fovs). (D) Inferred firing rates averaged over all stimulus amplitudes, neurons, and trials under Ctrl and PIN212C (orange) conditions. (E) Same for PINdlx. (F) Gain index as a function of inferred firing rate during PIN (212C: r = −0.56, N = 24 fov-stimulus pairs, p = 0.004; dlx: r = 0.81, N = 33 fov-stimulus pairs, p < 10−8). (G) Ca2+ imaging of odor responses during PIN. (H) Gain index over time during averaged odor responses (212C: n = 1190; dlx: n = 1788). Arrowhead: response onset. Color represents time; marker size is proportional to firing rate during PIN (x axis). (I) Change in gain index between peak (1.0 open circle in H) and 50% decay (0.5, closed circle in H) of responses for all fov-odor pairs; Wilcoxon rank-sum test: p = 0.009; 212C: N = 12; dlx: N = 19). Large circles: median. |
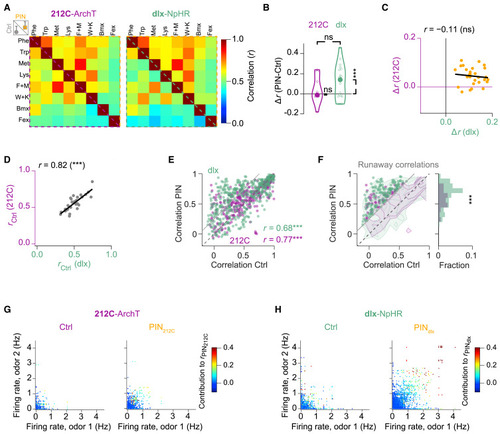
Functional signatures of EI assemblies in pDp: Population activity patterns and runaway correlations (A) Average Pearson correlation (r) of odor-evoked activity patterns under Ctrl (below the diagonal) and PIN conditions (above the diagonal; 212C: N = 12 fovs; dlx: N = 19 fovs). (B) Mean PIN-induced changes in pattern correlations (Δr = rPIN − rCtrl; bootstrap test, one-sided; 212C: p = 0.21, N = 12; dlx: p = 0.0005, N = 19; 212C vs. dlx, Wilcoxon rank-sum test: p = 0.33). Large circles: median. (C) Changes in correlations for the same odors (n = 28 odor pairs) during PIN212C and PINdlx (p = 0.72). (D) Mean pattern correlations (n = 28 odor pairs) for 212C and dlx lines during Ctrl conditions (p < 10−7). (E) Pattern correlations during PIN as a function of Ctrl correlations (p < 10−15 for all). Data above the gray line (Δr > 0.25) meet the criterion for runaway correlations. (F) Frequency of runaway correlations (Δr > 0.25) during PIN. Contour plots: overall distributions of correlations (logarithmic contour levels). Runaway correlations were significantly more frequent during PINdlx (p < 10−8; X2 test). (G) Neuron contributions to high pattern correlations. Each datapoint represents a neuron’s firing rates evoked by two odors during Ctrl and PIN212C conditions. Color indicates the contribution to the corresponding pairwise pattern correlation during PIN212C. (H) Same as (G) for PINdlx. Note large contributions to correlations by sparse subsets of neurons during PINdlx but not Ctrl conditions. |
|