
Fig. 7
- ID
- ZDB-FIG-250505-150
- Publication
- Meissner-Bernard et al., 2025 - Computational functions of precisely balanced neuronal microcircuits in an olfactory memory network
- Other Figures
- All Figure Page
- Back to All Figure Page
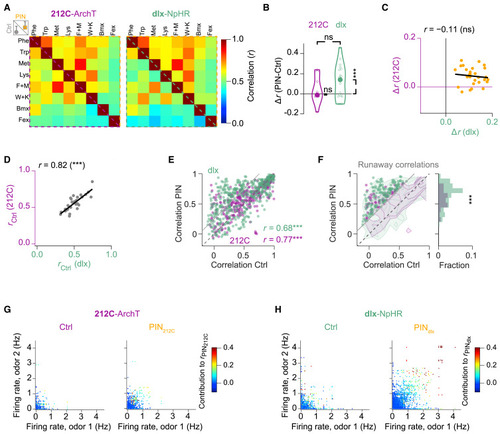
Functional signatures of EI assemblies in pDp: Population activity patterns and runaway correlations (A) Average Pearson correlation (r) of odor-evoked activity patterns under Ctrl (below the diagonal) and PIN conditions (above the diagonal; 212C: N = 12 fovs; dlx: N = 19 fovs). (B) Mean PIN-induced changes in pattern correlations (Δr = rPIN − rCtrl; bootstrap test, one-sided; 212C: p = 0.21, N = 12; dlx: p = 0.0005, N = 19; 212C vs. dlx, Wilcoxon rank-sum test: p = 0.33). Large circles: median. (C) Changes in correlations for the same odors (n = 28 odor pairs) during PIN212C and PINdlx (p = 0.72). (D) Mean pattern correlations (n = 28 odor pairs) for 212C and dlx lines during Ctrl conditions (p < 10−7). (E) Pattern correlations during PIN as a function of Ctrl correlations (p < 10−15 for all). Data above the gray line (Δr > 0.25) meet the criterion for runaway correlations. (F) Frequency of runaway correlations (Δr > 0.25) during PIN. Contour plots: overall distributions of correlations (logarithmic contour levels). Runaway correlations were significantly more frequent during PINdlx (p < 10−8; X2 test). (G) Neuron contributions to high pattern correlations. Each datapoint represents a neuron’s firing rates evoked by two odors during Ctrl and PIN212C conditions. Color indicates the contribution to the corresponding pairwise pattern correlation during PIN212C. (H) Same as (G) for PINdlx. Note large contributions to correlations by sparse subsets of neurons during PINdlx but not Ctrl conditions. |