
Fig. 3
- ID
- ZDB-FIG-250505-146
- Publication
- Meissner-Bernard et al., 2025 - Computational functions of precisely balanced neuronal microcircuits in an olfactory memory network
- Other Figures
- All Figure Page
- Back to All Figure Page
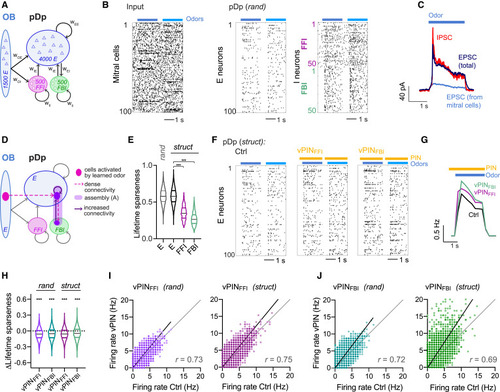
Computational model of pDp (A) pDpsim. (B) Spike raster of randomly selected subsets of 100 mitral cells (afferent input), 100 E neurons, 50 FFI neurons, and 50 FBI neurons. Two odors (bars) were applied by changing the firing rates of specific mitral cell subsets for 2 s. (C) EPSCs (black) and IPSCs (red) averaged across odors and E neurons. Blue: mitral cells (afferent) contribution to EPSCs. (D) EI assembly in a struct network. (E) Lifetime sparseness of E neurons in rand networks and E, FFI, and FBI neurons in struct networks (n = 4,000, n = 8,000, n = 1,000, and n = 1,000 from left to right). E neurons were more sharply tuned than FFI (Wilcoxon rank-sum test: p < 0.0001) and FBI (p < 0.0001) neurons. (F) Spike raster of the 100 E neurons in (B) in a corresponding struct network under Ctrl, vPINFFI, and vPINFBI conditions. (G) Firing rate averaged over all odors and E neurons. Bars depict odor presentation (blue) and vPIN (yellow). (H) vPIN-induced change in lifetime sparseness (vPIN – Ctrl; Wilcoxon signed-rank test for difference from zero: p < 0.0001 for all). (I) Odor-evoked firing rates of individual neurons during vPINFFI as a function of their Ctrl firing rates in rand and struct networks (20 odors, 200 neurons, 10 networks). (J) Same as (I) for vPINFBI. |