
Fig. 2
- ID
- ZDB-FIG-250505-145
- Publication
- Meissner-Bernard et al., 2025 - Computational functions of precisely balanced neuronal microcircuits in an olfactory memory network
- Other Figures
- All Figure Page
- Back to All Figure Page
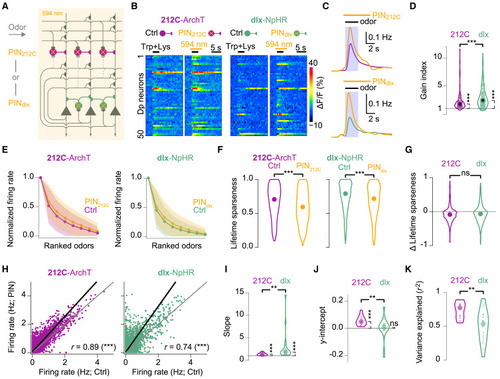
Modulation of odor responses by inhibitory interneurons in pDp (A) Photoinhibition (PIN) of 212C or dlx interneurons during odor stimulation and 2-photon Ca2+ imaging in 212C-ArchTGFP or dlx-NpHR3YFP fish. (B) Odor-evoked Ca2+ signals in 50 randomly selected pDp neurons under control (Ctrl) and PIN conditions (average of 2 trials). Bars: light exposure and odor stimulation. (C) Inferred firing rates averaged over neurons, trials, and odors under Ctrl and PIN (orange) conditions (212C: n = 1,190; dlx: n = 1,788). Shaded area: 3-s window used for most analyses. Top: 212C; bottom: dlx. (D) Gain index (mean activity during PIN normalized to Ctrl). Circles: fov-odor combinations. Gain indices differed significantly from unity (bootstrap test, one sided; 212C: p < 10−5, n = 96; dlx: p < 10−5, n = 152) and between lines (Wilcoxon rank-sum test: p < 10−4). Black circles: median. (E) Rank-ordered odor tuning curves averaged across neurons; same neurons as in (C). Shading: SD. (F) Lifetime sparseness of odor responses (Wilcoxon signed-rank test, two sided; same neurons as in C; 212C: p < 10−15; dlx: p < 10−15; 212C vs. dlx: p = 0.09). Circles (F and G): median. (G) Distribution of changes in lifetime sparseness (PIN – Ctrl). (H) Amplitudes of individual odor responses under Ctrl and PIN conditions for each neuron-odor pair (212C: n = 10,710, N = 12 fovs; dlx: n = 16,092, N = 19 fovs). Black line: linear fit (total least squares). (I) Slopes of linear fits for each fov (difference from unity: bootstrap test, one-sided; 212C: p < 10−5, N = 12; dlx: p < 10−5, N = 19; difference between 212C and dlx: Wilcoxon rank-sum test: p = 0.004). Large circles (I–K): median. (J) y intercepts of linear fits for each fov (same fovs as in I; 212C: p < 10−5; dlx: p = 0.89; difference between 212C and dlx: p = 0.007). (K) Variance explained by linear fits in individual fovs (Wilcoxon rank-sum test: p = 0.006). |