
Fig. 6
- ID
- ZDB-FIG-250505-149
- Publication
- Meissner-Bernard et al., 2025 - Computational functions of precisely balanced neuronal microcircuits in an olfactory memory network
- Other Figures
- All Figure Page
- Back to All Figure Page
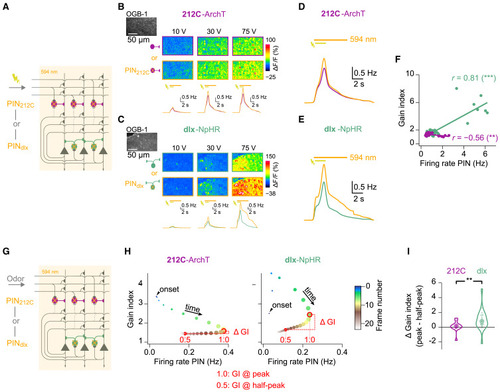
Functional signatures of EI assemblies in pDp: Nonlinear amplification (A) Electrical stimulation of mOT (20 pulses, 10 Hz) during 2-photon Ca2+ imaging and PIN. (B) Raw fluorescence (OGB-1) and evoked Ca2+ signals under Ctrl and PIN212C (212C-ArchTGFP) conditions for three stimulus amplitudes (single trials). Bottom: inferred firing rates averaged across neurons (n = 903; N = 12 fovs) and trials (n = 2). Bars: mOT stimulation (2 s) and 594 nm illumination for PIN (6.8 s). (C) Same for PINdlx (dlx-eNpHR3.0YFP; n = 2,358 neurons; N = 18 fovs). (D) Inferred firing rates averaged over all stimulus amplitudes, neurons, and trials under Ctrl and PIN212C (orange) conditions. (E) Same for PINdlx. (F) Gain index as a function of inferred firing rate during PIN (212C: r = −0.56, N = 24 fov-stimulus pairs, p = 0.004; dlx: r = 0.81, N = 33 fov-stimulus pairs, p < 10−8). (G) Ca2+ imaging of odor responses during PIN. (H) Gain index over time during averaged odor responses (212C: n = 1190; dlx: n = 1788). Arrowhead: response onset. Color represents time; marker size is proportional to firing rate during PIN (x axis). (I) Change in gain index between peak (1.0 open circle in H) and 50% decay (0.5, closed circle in H) of responses for all fov-odor pairs; Wilcoxon rank-sum test: p = 0.009; 212C: N = 12; dlx: N = 19). Large circles: median. |