
|
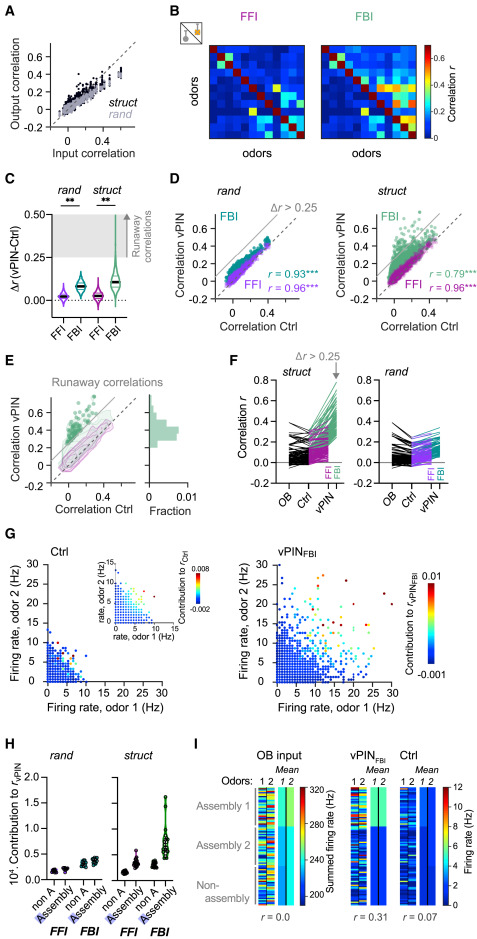
Fig. 4 Runaway correlations during imbalanced FBI in networks with EI assemblies (A) Pearson correlations between odor-evoked activity patterns across E neurons (output correlation) as a function of the correlation between the corresponding afferent activity patterns (input correlation) in rand and struct networks. (B) Example of pattern correlations for 12 odors under Ctrl conditions (below diagonal) and during vPINFFI and vPINFBI (above diagonal) in one struct network. (C) vPIN-induced changes in pattern correlation r (n = 190 odor pairs, 10 rand and 20 struct networks; Wilcoxon signed-rank test: p < 0.0001). Shading depicts Δr > 0.25, the operational criterion for runaway correlations. (D) Pattern correlations during vPINFFI and vPINFBI as a function of correlations under Ctrl conditions in rand and struct networks. Datapoints above the gray line (Δr > 0.25) fulfill the criterion for runaway correlations. (E) vPIN-induced changes in correlation in struct networks. Contour plots show distributions of correlations (same data as in D; logarithmic contour levels). Datapoints show runaway correlations; the histogram shows relative frequency. No runaway correlations occurred during vPINFFI. (F) Odor pair-network combinations were selected for occurrence of runaway correlations (Δr > 0.25 during vPINFBI) in struct networks. Left: runaway correlations compared to the correlations between input patterns and output patterns under Ctrl and vPINFFI conditions. Lines connect the datapoints from the same odor pair-network combinations. Right: correlations in the corresponding rand networks. (G) Contribution of individual neurons to high pattern correlations during vPINFBI. Each datapoint shows the firing rates evoked by two odors in one neuron under Ctrl conditions or during vPINFBI and the neuron’s contribution to the corresponding pairwise pattern correlation during vPINFBI (color code). Inset (left): the color code indicates a neuron’s contribution during Ctrl conditions. N = 87 odor pairs from 10 networks, 80 randomly selected neurons for each odor pair (STAR Methods). (H) Contribution of E neurons to all pattern correlations, averaged over assembly neurons and neurons outside assemblies (non-A). (I) Example of activity patterns evoked by two dissimilar odors across E neurons from two assemblies and outside assemblies (left: 30 randomly selected neurons per group; right: mean activity of each group). Left: OB input. Right: activity under Ctrl conditions and during vPINFBI. Assembly 1 received stronger mean input from both odors than assembly 2 and neurons outside assemblies. Note the increased pattern correlation r due to nonlinear amplification of activity in assembly 1 during vPINFBI.