FIGURE SUMMARY
Title

Understanding the Role of Exercise and Probiotic Interventions on Non-Alcoholic Fatty Liver Disease Alleviation in Zebrafish: Dialogue Between the Gut and Liver

Authors
Gu, X., Yuan, L., Gan, L., Zhang, Z., Zhou, S., Fu, Z., Liu, Y., Xin, Z., Cheng, S., Zhou, X., Yan, H., Wang, Q.
Source
Full text @ Int. J. Mol. Sci.

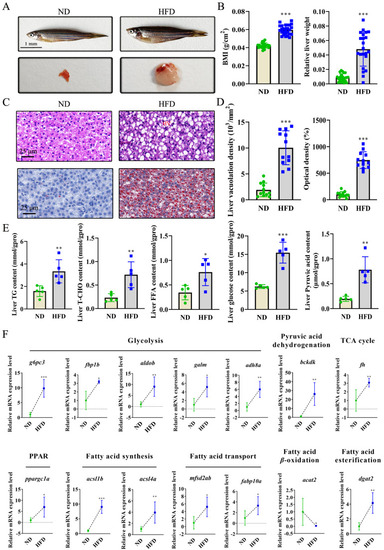
High-fat diet (HFD)-induced non-alcoholic fatty liver disease (NAFLD) progression involved in glucose and fatty acid metabolism: (A,B) Photographed fish and liver and corresponding Body Mass Index (BMI) and relative liver weight in normal diet (ND) and HFD groups. (C,D) Liver sections by hematoxylin-eosin (HE) and Oil Red O (ORO) staining and their corresponding liver vacuolation density in HE-stained sections and optical density in ORO staining. (E) Biochemical determination on lipid indicators including triglyceride (TG), total cholesterol (T-CHO), free fatty acid (FFA), glucose, and its metabolic intermediate of pyruvic acid. (F) Transcriptional levels of the genes related to glucose metabolism (glycolysis, pyruvic acid dehydrogenation, TCA cycle), and fatty acid metabolism (PPAR pathway transduction, fatty acid synthesis, fatty acid transport, fatty acid esterification, and fatty acid β-oxidation), determined using qRT-PCR. Values are the mean ± SD. * p < 0.05, ** p < 0.01, *** p < 0.001 vs. control.

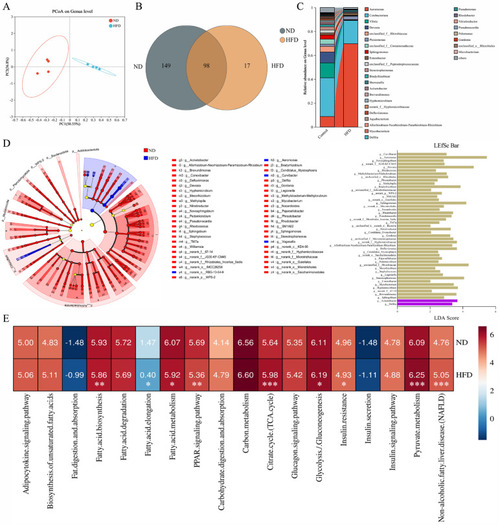
Alterations in gut microbiota may induce NAFLD by changing the glucose and fatty acid metabolism: (A) Principal coordinate analysis (PCoA) of gut microbiota on the genus level in different groups. (B) Venn chart for genera in ND and HFD groups. (C) Percentage of community abundance on the genus level after ND and HFD treatments. (D) Linear discriminant analysis (LDA) effect size (LEfSe) of the gut microbiota from the phylum to genus levels with LDA values >2 and p values <0.05 in different groups. The yellow nodes represent microbial groups that do not differ significantly between groups, or have no significant effect on differences between groups. (E) Comparison of biological processes associated with glucose and fatty acid metabolism in ND and HFD groups based on log10 of KEGG pathway abundances at level 3 using the phylogenetic investigation of communities by the reconstruction of unobserved states 2 (PICRUSt2). * p < 0.05, ** p < 0.01, *** p < 0.001 vs. control.

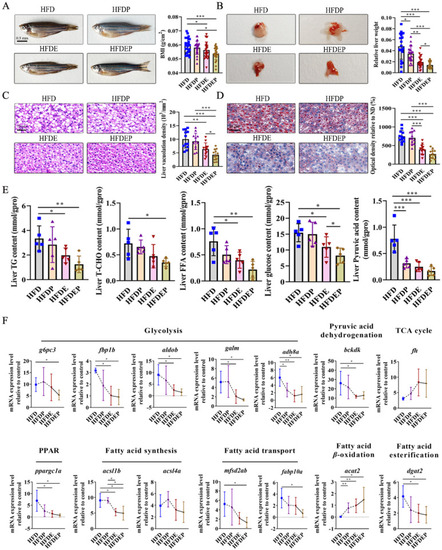
Effects of different intervention strategies on NAFLD: (A) Photographed fish and corresponding BMI. (B) Photographed liver and corresponding relative liver weight. (C,D) Histopathological sections of liver by HE and ORO staining, as well as their corresponding liver vacuolation density and optical density. Scale bar: 25 µm. (E) Determination on lipid indicators. (F) Expression levels of genes related to glucose (glycolysis, pyruvic acid dehydrogenation, and TCA cycle) and fatty acid metabolism (PPAR pathway transduction, fatty acid synthesis, fatty acid transport, fatty acid esterification, and fatty acid β-oxidation). Values are the mean ± SD. * p < 0.05, ** p < 0.01, *** p < 0.001 vs. control.

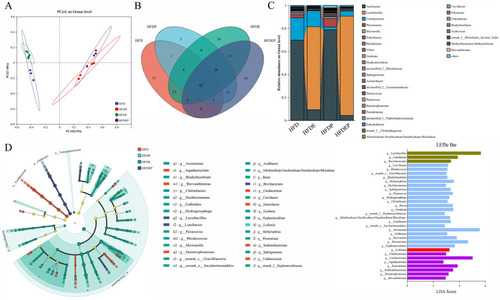
Gut microbial change under different intervention modes: (A) PCoA of gut microbiota on the genus level in different groups. Venn chart (B) and percentage of community abundance (C) for gut genera after different treatments. (D) LEfSe of the gut microbiota from the phylum to genus levels with LDA values > 2 and p values < 0.05 in different groups. The yellow nodes represent microbial groups that do not differ significantly among groups, or have no significant effect on differences among groups.

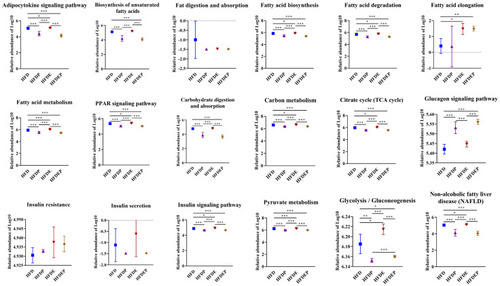
Gut microbial functional change by different intervention modes. Comparison of biological processes associated with glucose and fatty acid metabolism in different groups based on log10 of KEGG pathway abundances at level 3 using PICRUSt2. Values are the mean ± SD. * p < 0.05, ** p < 0.01, *** p < 0.001 vs. control.

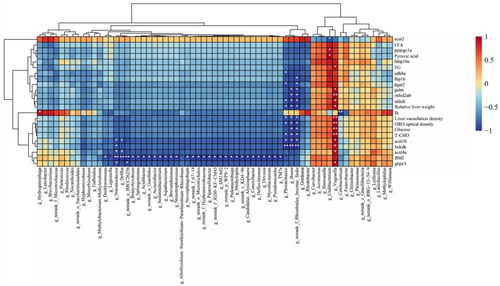
Correlation analysis between altered gut microbiota and lipid indicators. * p < 0.05, and ** p < 0.01.

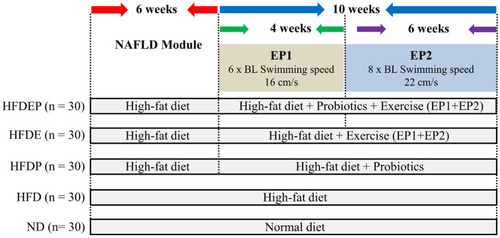
Schematic of experimental design.

Acknowledgments
This image is the copyrighted work of the attributed author or publisher, and ZFIN has permission only to display this image to its users. Additional permissions should be obtained from the applicable author or publisher of the image. Full text @ Int. J. Mol. Sci.