IMAGE

Figure 1

ID
ZDB-IMAGE-250215-64
Source
Figures for Gu et al., 2025
Image
Figure Caption

Figure 1

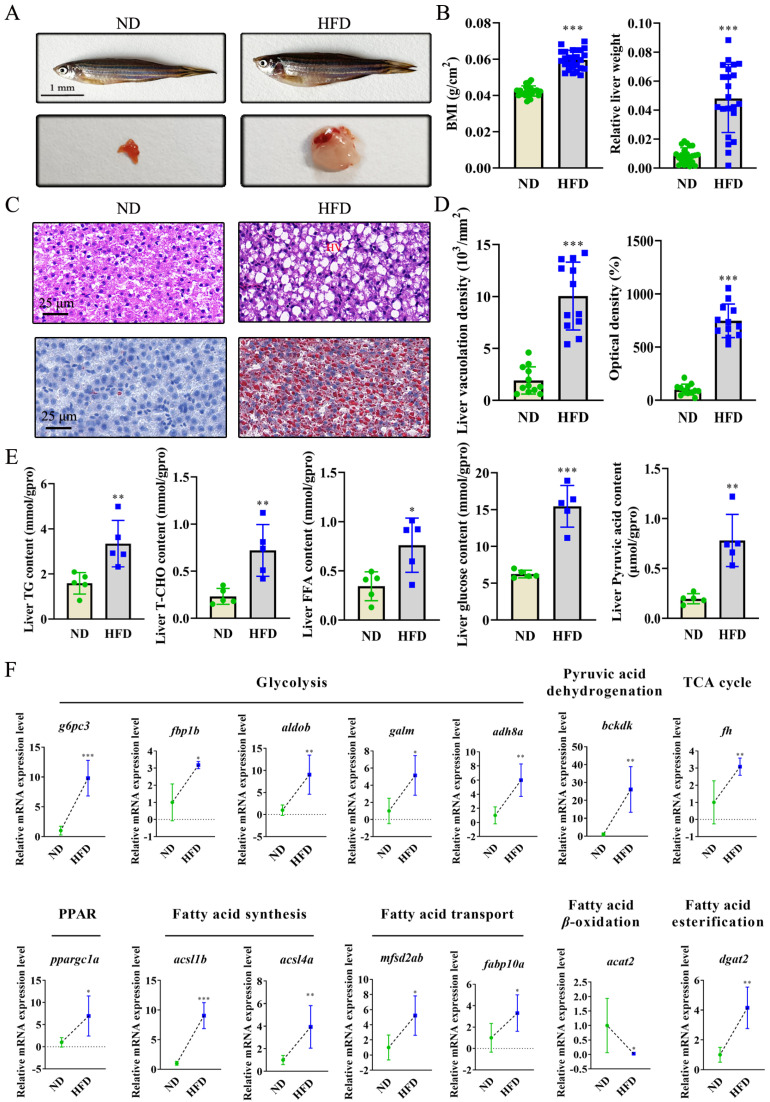
High-fat diet (HFD)-induced non-alcoholic fatty liver disease (NAFLD) progression involved in glucose and fatty acid metabolism: (A,B) Photographed fish and liver and corresponding Body Mass Index (BMI) and relative liver weight in normal diet (ND) and HFD groups. (C,D) Liver sections by hematoxylin-eosin (HE) and Oil Red O (ORO) staining and their corresponding liver vacuolation density in HE-stained sections and optical density in ORO staining. (E) Biochemical determination on lipid indicators including triglyceride (TG), total cholesterol (T-CHO), free fatty acid (FFA), glucose, and its metabolic intermediate of pyruvic acid. (F) Transcriptional levels of the genes related to glucose metabolism (glycolysis, pyruvic acid dehydrogenation, TCA cycle), and fatty acid metabolism (PPAR pathway transduction, fatty acid synthesis, fatty acid transport, fatty acid esterification, and fatty acid β-oxidation), determined using qRT-PCR. Values are the mean ± SD. * p < 0.05, ** p < 0.01, *** p < 0.001 vs. control.

Acknowledgments
This image is the copyrighted work of the attributed author or publisher, and ZFIN has permission only to display this image to its users. Additional permissions should be obtained from the applicable author or publisher of the image. Full text @ Int. J. Mol. Sci.