
FIGURE
Figure 4
- ID
- ZDB-FIG-250215-67
- Publication
- Gu et al., 2025 - Understanding the Role of Exercise and Probiotic Interventions on Non-Alcoholic Fatty Liver Disease Alleviation in Zebrafish: Dialogue Between the Gut and Liver
- Other Figures
- All Figure Page
- Back to All Figure Page
Figure 4
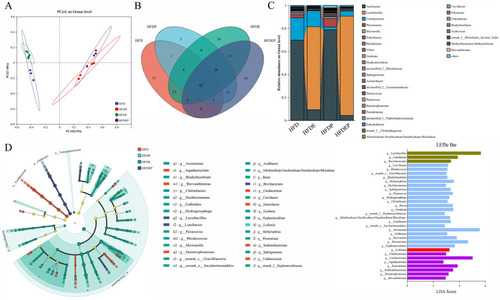
Gut microbial change under different intervention modes: ( |
Expression Data
Expression Detail
Antibody Labeling
Phenotype Data
Phenotype Detail
Acknowledgments
This image is the copyrighted work of the attributed author or publisher, and
ZFIN has permission only to display this image to its users.
Additional permissions should be obtained from the applicable author or publisher of the image.
Full text @ Int. J. Mol. Sci.