IMAGE

Figure 2

ID
ZDB-IMAGE-250215-65
Source
Figures for Gu et al., 2025
Image
Figure Caption

Figure 2

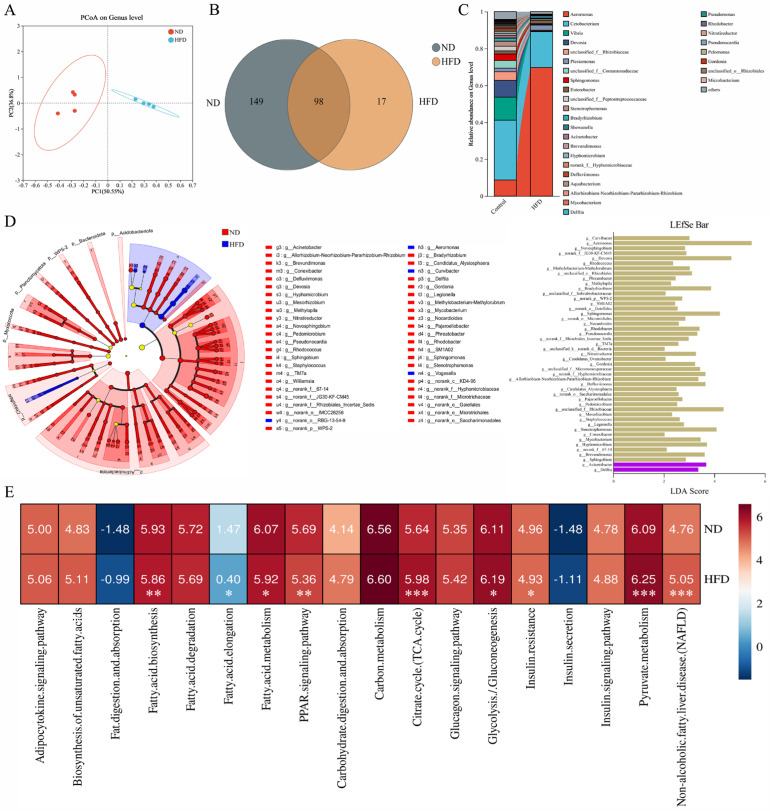
Alterations in gut microbiota may induce NAFLD by changing the glucose and fatty acid metabolism: (A) Principal coordinate analysis (PCoA) of gut microbiota on the genus level in different groups. (B) Venn chart for genera in ND and HFD groups. (C) Percentage of community abundance on the genus level after ND and HFD treatments. (D) Linear discriminant analysis (LDA) effect size (LEfSe) of the gut microbiota from the phylum to genus levels with LDA values >2 and p values <0.05 in different groups. The yellow nodes represent microbial groups that do not differ significantly between groups, or have no significant effect on differences between groups. (E) Comparison of biological processes associated with glucose and fatty acid metabolism in ND and HFD groups based on log10 of KEGG pathway abundances at level 3 using the phylogenetic investigation of communities by the reconstruction of unobserved states 2 (PICRUSt2). * p < 0.05, ** p < 0.01, *** p < 0.001 vs. control.

Acknowledgments
This image is the copyrighted work of the attributed author or publisher, and ZFIN has permission only to display this image to its users. Additional permissions should be obtained from the applicable author or publisher of the image. Full text @ Int. J. Mol. Sci.