
Image
|
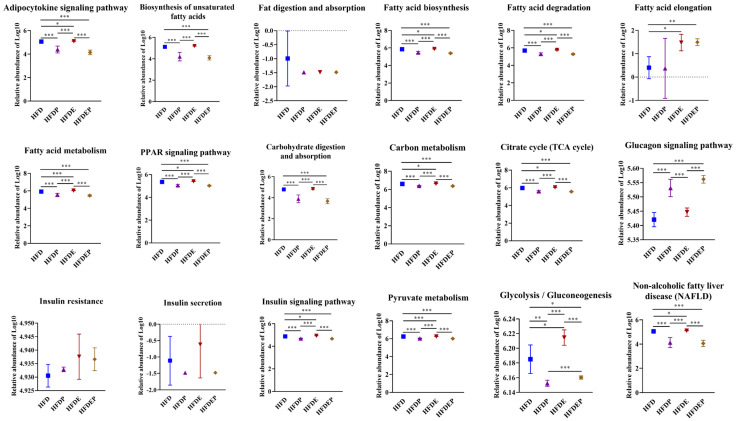
Figure Caption
Figure 5
Gut microbial functional change by different intervention modes. Comparison of biological processes associated with glucose and fatty acid metabolism in different groups based on log10 of KEGG pathway abundances at level 3 using PICRUSt2. Values are the mean ± SD. *
Acknowledgments
This image is the copyrighted work of the attributed author or publisher, and
ZFIN has permission only to display this image to its users.
Additional permissions should be obtained from the applicable author or publisher of the image.
Full text @ Int. J. Mol. Sci.